Vea también

 04.07.2025 03:56 AM
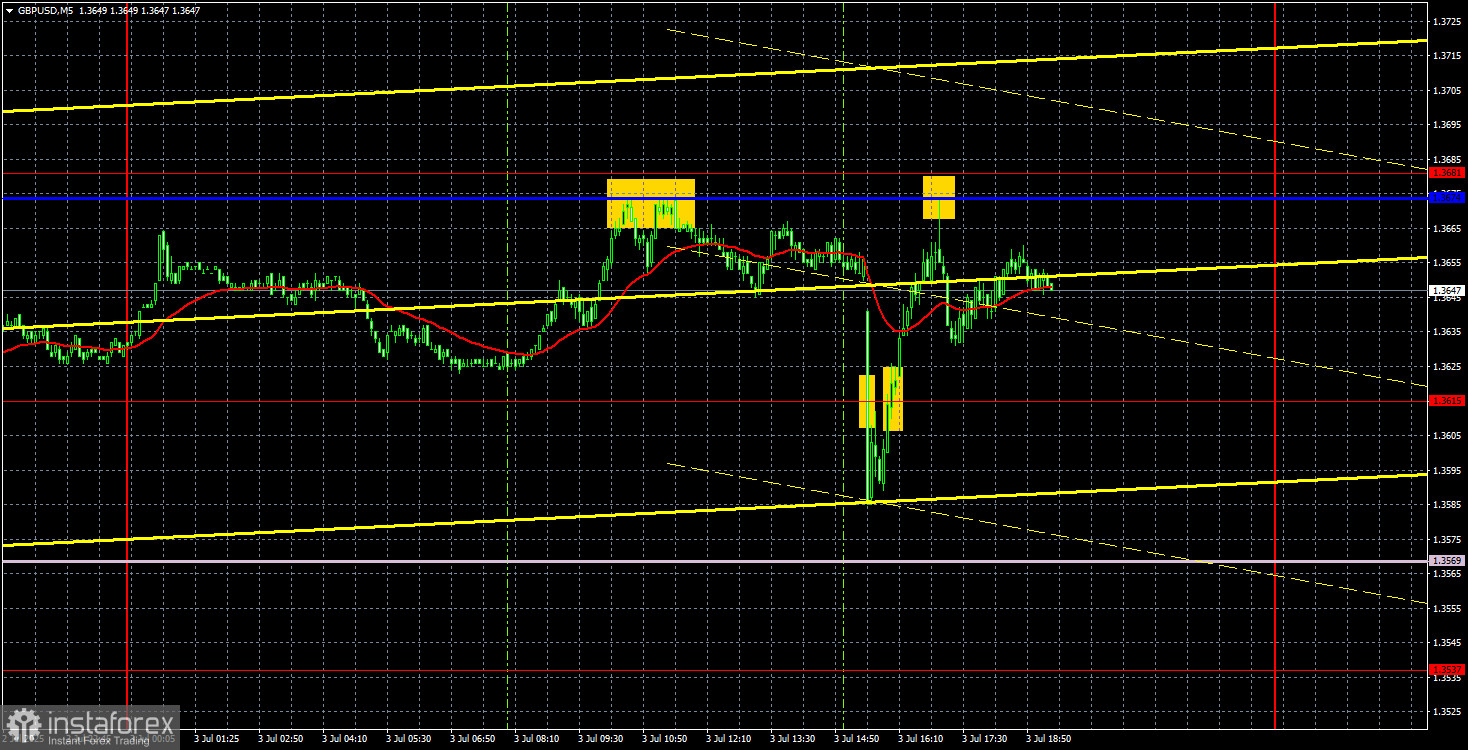
The GBP/USD currency pair on Thursday showed nearly identical movements to the EUR/USD pair. This is not surprising, as over the last five months it's not the euro or the pound that have been rising in price, but rather the dollar that has been falling. Therefore, in 95% of cases, it is the dollar that either drops or doesn't. This week, the British pound came under pressure only once due to factors unrelated to U.S. news. However, we believe Wednesday's drop was simply a manipulation by market makers. As we saw, even on strong U.S. data on Thursday, the dollar essentially failed to continue its growth. Thus, we would say that the U.S. dollar is preparing for another decline. A downward correction — which barely started on the hourly timeframe — may continue for a while. After all, the price broke through the critical Kijun-sen line. Nevertheless, we still don't believe in a strong dollar rally as long as Donald Trump doesn't change the course of his policies.
From a technical standpoint, even on the hourly timeframe, we can't say that a new downward trend has started. The last upward wave was virtually without any pullbacks, so building trend lines or channels didn't make sense — any movement down would break through them. And over the last two days, we've seen a correction, but the price still failed to consolidate below the Senkou Span B line. Therefore, we believe that even on the hourly chart, the upward trend remains intact.
Several trading signals were formed on Thursday. Perhaps the calmest was the first sell signal near the Kijun-sen line. During the publication of U.S. data, traders could have stayed in short positions, but as we've already concluded, the dollar's growth was short-lived. A buy signal around the 1.3615 level could be acted upon, and the price reached the critical line, bounced off it, and allowed traders to profit again on short positions.
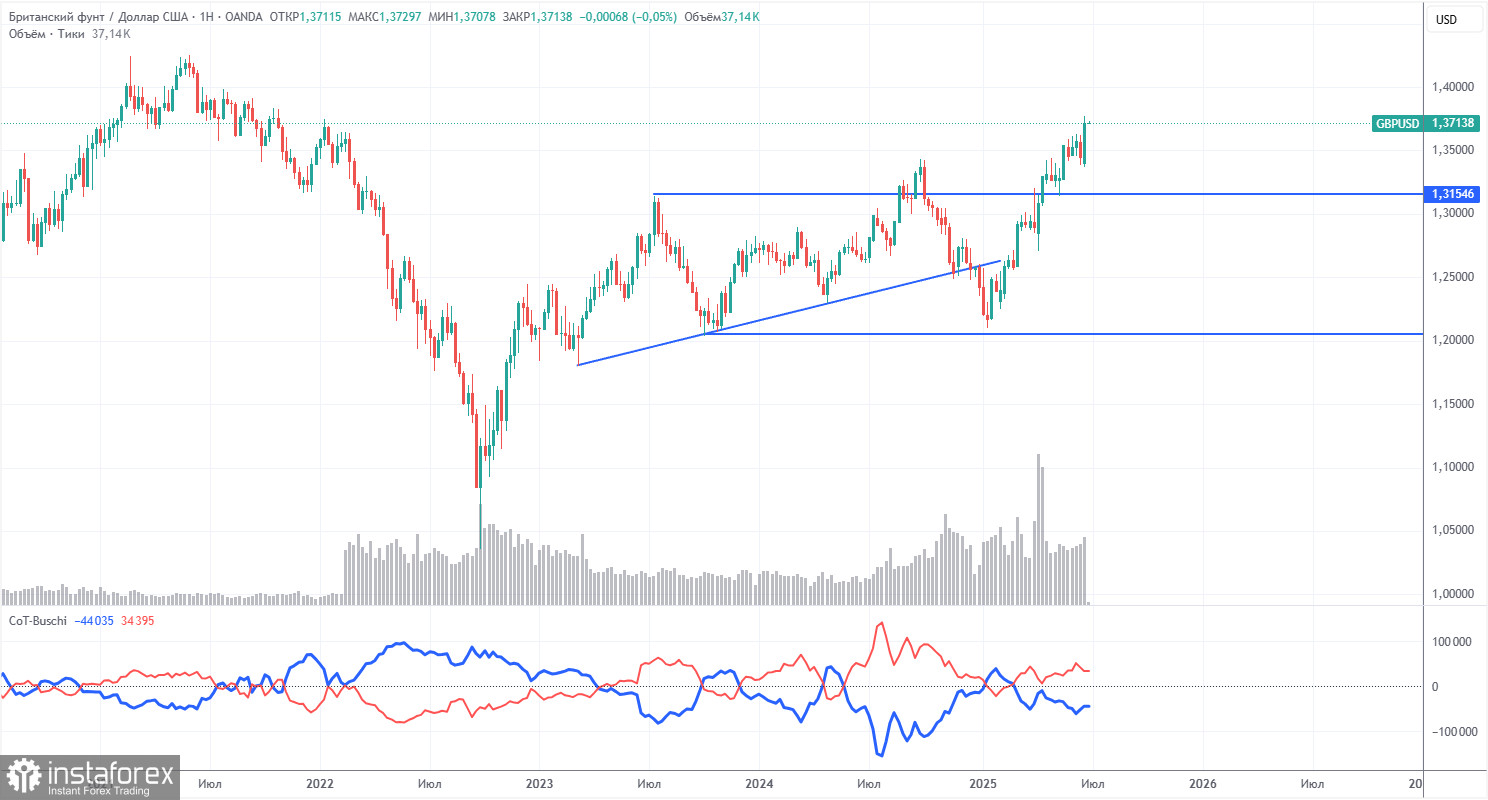
COT reports for the British pound indicate that commercial traders' sentiment has shifted constantly over the past few years. The red and blue lines, representing the net positions of commercial and non-commercial traders, frequently cross and typically remain near the zero line. Currently, they are also close to each other, indicating a roughly equal number of buy and sell positions. However, over the past year and a half, the net position has been increasing.
The dollar continues to weaken due to Trump's policies, making sterling demand among market makers less relevant at the moment. The trade war will continue in some form, and the Fed's key interest rate may drop significantly in the coming years — more than the economic outlook justifies. Thus, demand for the dollar will fall regardless. According to the latest COT report on the pound, the "Non-commercial" group closed 6,400 buy contracts and 2,000 sell contracts. This means the net position shrank by 8,400 contracts, but this carries virtually no significance.
In 2025, the pound has seen a sharp increase, but there's one main reason — Trump's policies. Once this factor fades, the dollar could start recovering. But when that happens, it is anyone's guess. Trump is only at the beginning of his presidency, and the next four years may bring many more shocks.
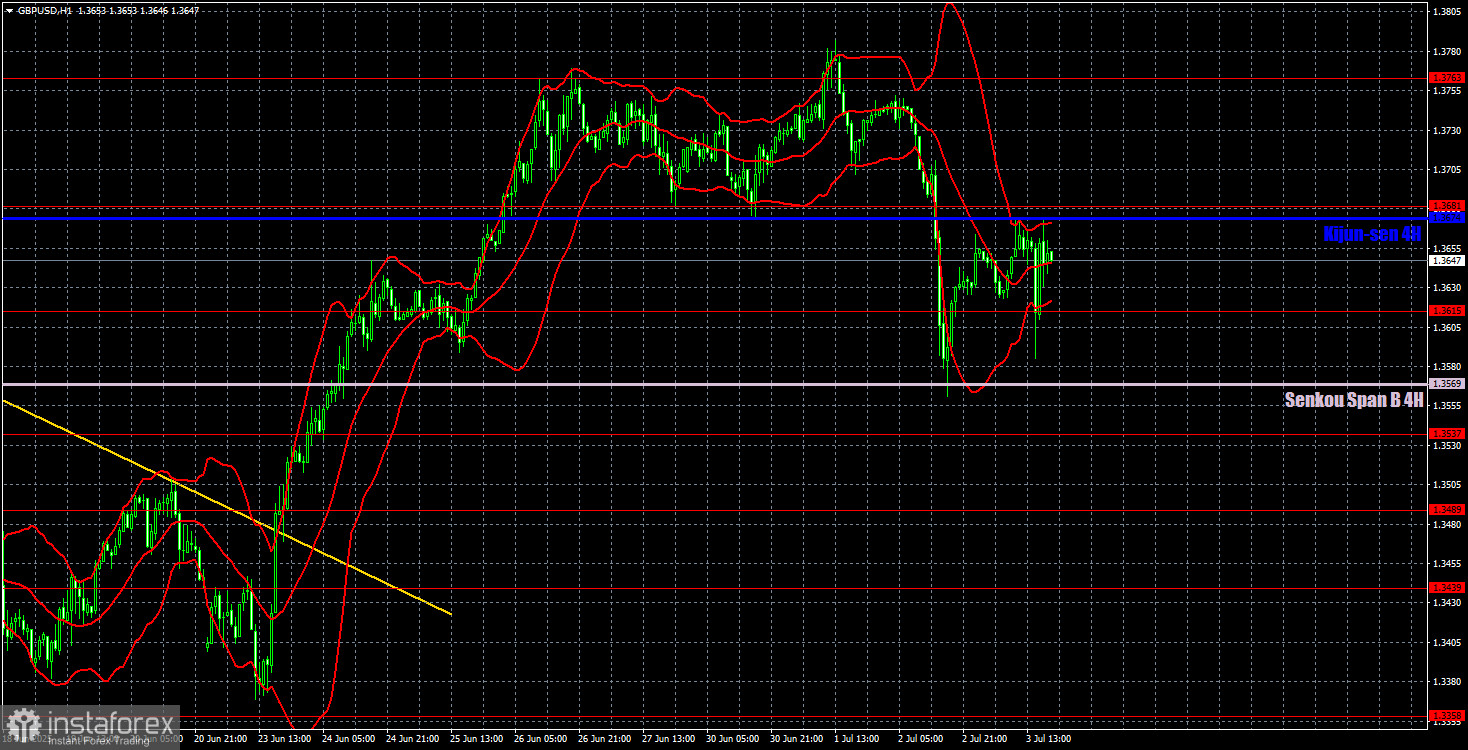
On the hourly timeframe, the GBP/USD pair fell sharply, but there were no significant reasons for the decline on Wednesday. On Thursday, although reasons did exist, the drop did not occur. The decline stopped near the Senkou Span B line, so this could mark the end of the "dollar's resurrection." Liquidity for buying has been gathered, and the upward trend may continue. If the price consolidates below Senkou Span B, that would indicate a continuation of the downward correction, although this scenario currently seems unlikely.
For July 4, we highlight the following key levels for trading: 1.3212, 1.3288, 1.3358, 1.3439, 1.3489, 1.3537, 1.3615, 1.3741–1.3763, 1.3833, 1.3886. Senkou Span B (1.3569) and Kijun-sen (1.3674) lines may also serve as signal levels. It is recommended to set the Stop Loss to breakeven once the price moves 20 pips in the desired direction. The Ichimoku indicator lines may shift during the day, so be aware of this when identifying trading signals.
On Friday, there are no significant events scheduled in the UK or the U.S. It is a public holiday in the United States. Therefore, we may observe low volatility and flat movements, especially during the American trading session.


