Vea también

 15.07.2025 06:45 AM
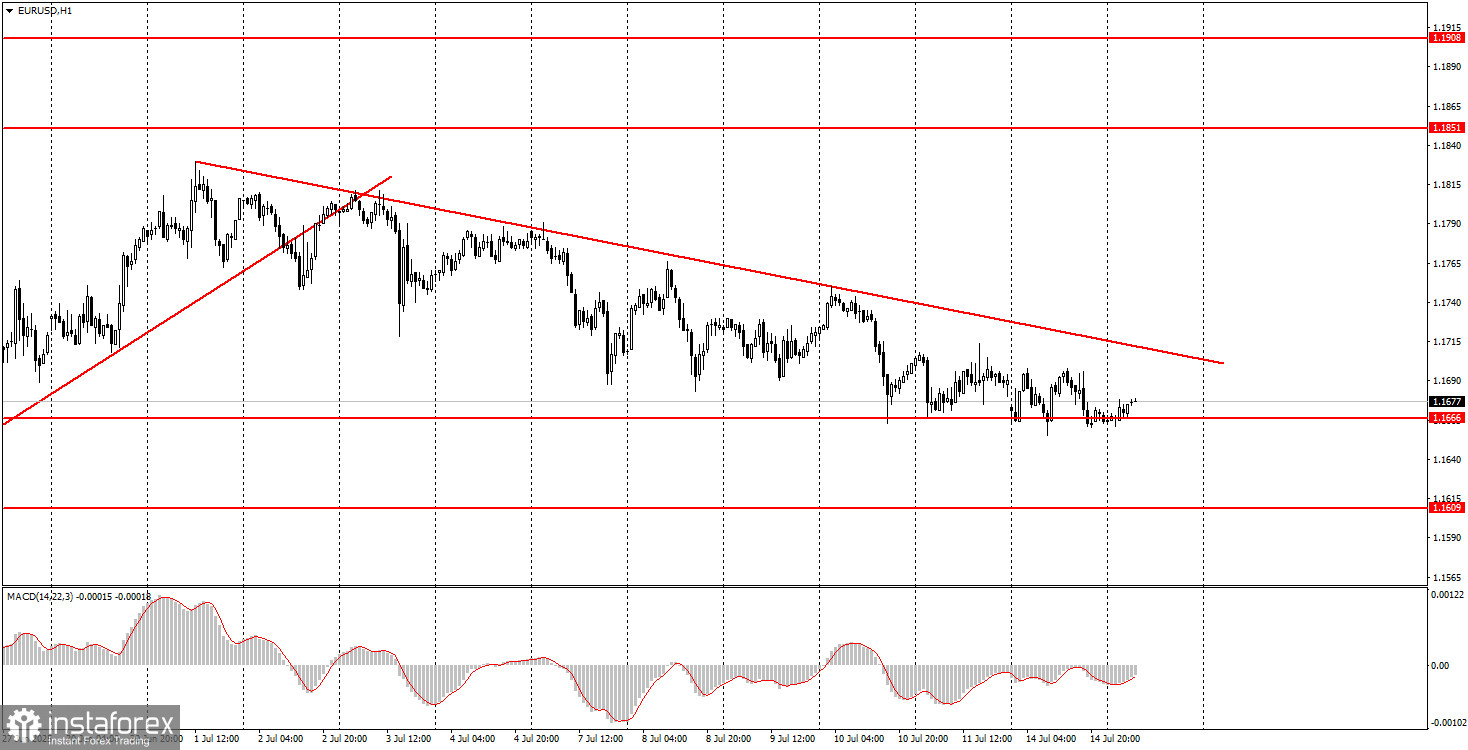
On Monday, the EUR/USD currency pair formally continued its downward movement but in practice traded sideways with low volatility for the second consecutive day. The 1.1666 level has yet to be breached. It's possible that, with a suitable fundamental or macroeconomic backdrop (e.g., today), this level may finally be broken. The U.S. inflation report is a significant macroeconomic event and could trigger a 50-point rise in the dollar. However, the pair's behavior over the past two weeks suggests we're witnessing a simple, ordinary correction. It's also worth recalling that last week and this week, Donald Trump has been actively raising and introducing new trade tariffs. As such, the U.S. dollar lacks any real fundamental support. We believe the uptrend that began back in January 2025 is likely to continue.
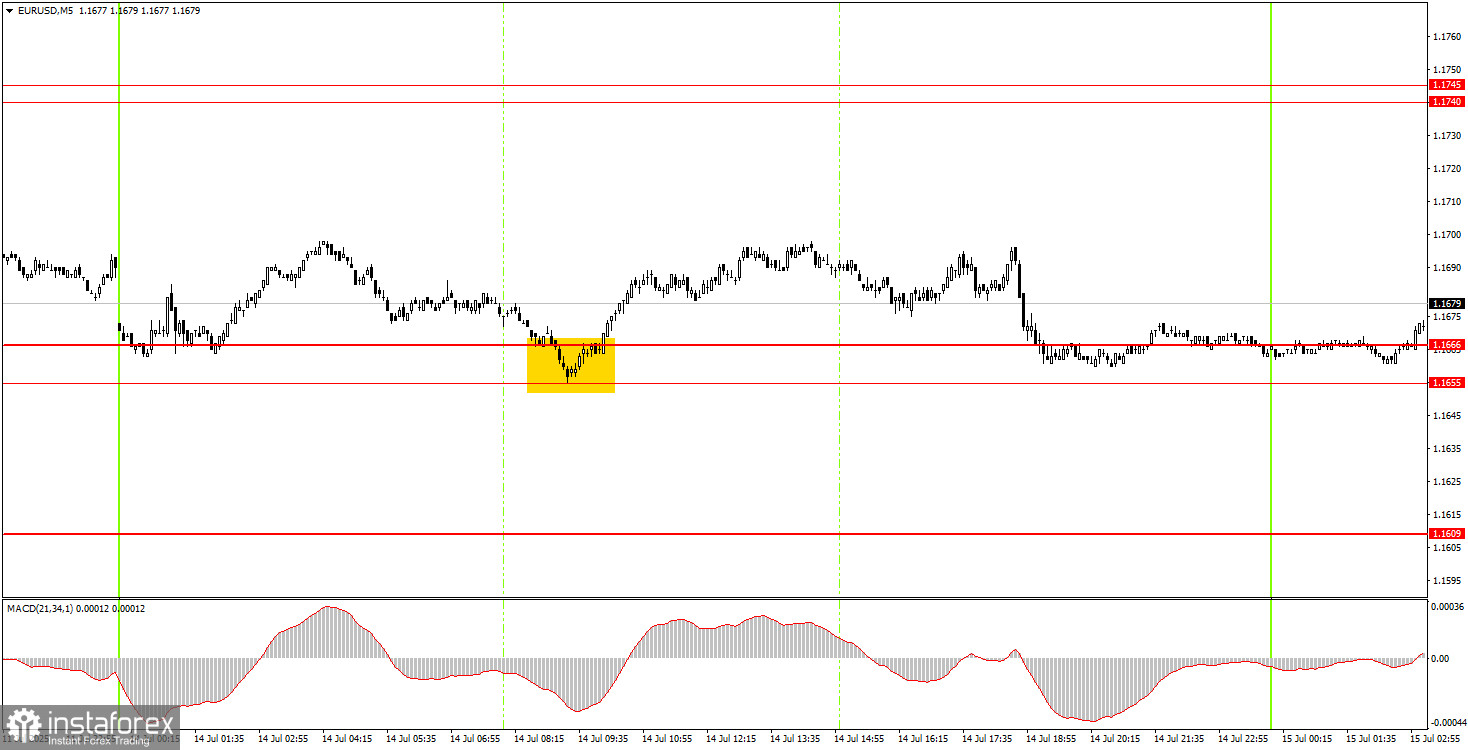
On the 5-minute timeframe, only one trading signal was formed on Monday. Early in the European session, the price rebounded (inaccurately) from the 1.1666 level, which by the end of the day was supplemented by 1.1655. Due to low volatility, the price then moved up about 20 points. That's better than nothing, but volatility is currently too low to expect substantial profits.
On the hourly timeframe, the EUR/USD pair is still correcting, but the five-month uptrend remains intact. The ongoing decline in the U.S. dollar is still primarily driven by the fact that Donald Trump is the President of the United States. The dollar (like any other currency or instrument) needs to correct from time to time (which is what we're seeing now), but the overall fundamental background makes it difficult to expect sustained strength from the U.S. dollar in the medium term. A break above the trendline would signal the end of the current downward move on the hourly timeframe.
On Tuesday, the EUR/USD pair may again attempt to break through the strong 1.1666 level, but the five previous rebounds from this level suggest it is well-defended. A consolidation below 1.1666 would indicate the continuation of the local downtrend, while a break above the trendline would signal its completion.
On the 5-minute timeframe, consider the following levels: 1.1198–1.1218, 1.1267–1.1292, 1.1354–1.1363, 1.1413, 1.1455–1.1474, 1.1527, 1.1561–1.1571, 1.1609, 1.1655–1.1666, 1.1740–1.1745, 1.1808, 1.1851, 1.1908.
On Tuesday, the Eurozone industrial production report and the U.S. inflation report will be published. Both releases could trigger market reactions, so sharp reversals or increased volatility are possible during their publication.
Support and Resistance Levels: These are target levels for opening or closing positions and can also serve as points for placing Take Profit orders.
Red Lines: Channels or trendlines indicating the current trend and the preferred direction for trading.
MACD Indicator (14,22,3): A histogram and signal line used as a supplementary source of trading signals.
Important Events and Reports: Found in the economic calendar, these can heavily influence price movements. Exercise caution or exit the market during their release to avoid sharp reversals.
Forex trading beginners should remember that not every trade will be profitable. Developing a clear strategy and practicing proper money management are essential for long-term trading success.


