Vea también

 15.07.2025 06:45 AM
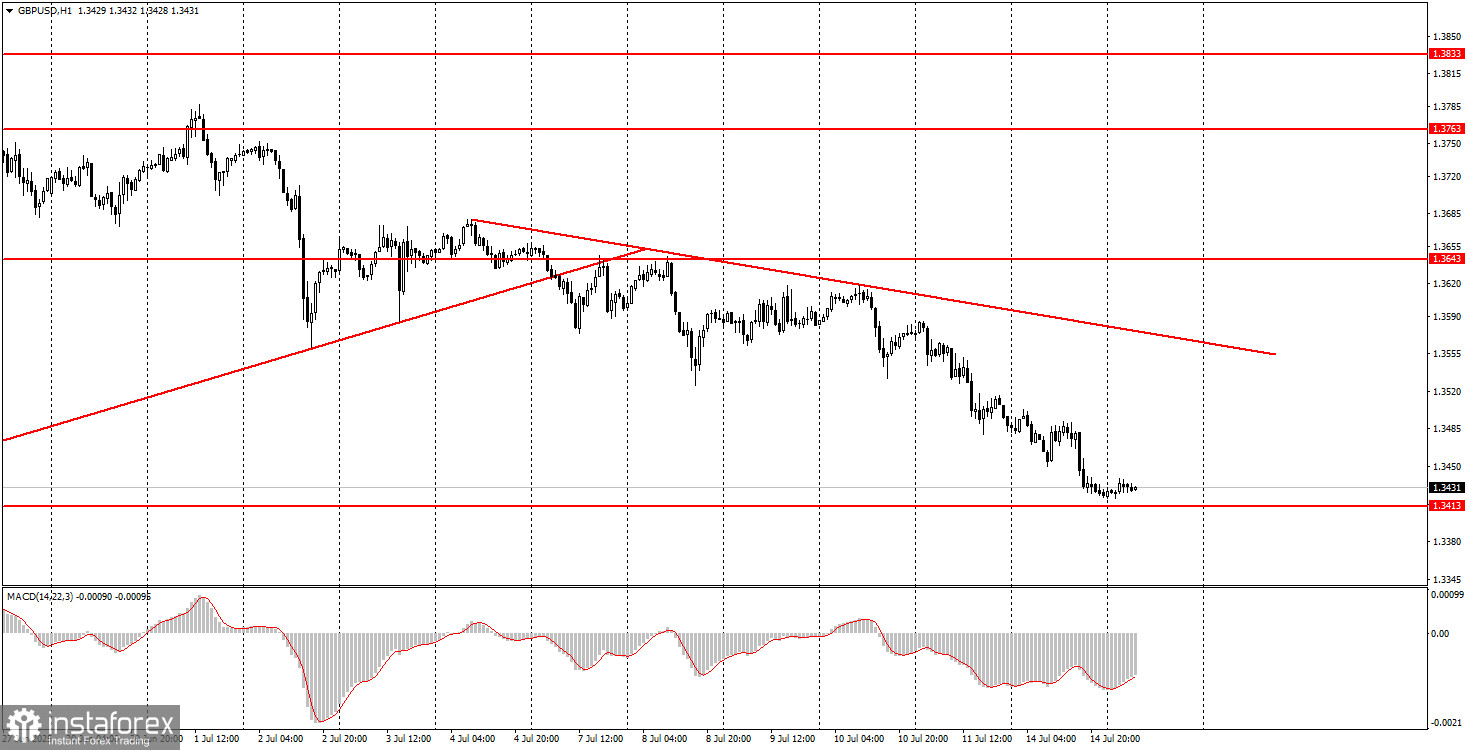
On Monday, the GBP/USD pair continued its downward movement. Recently, the euro and the pound have shown low correlation, as the euro has remained flat for several days while the British pound has been falling throughout this period. However, essentially, both currency pairs are in a downward correction. In both cases, this is a purely technical correction, as there are currently no fundamental or macroeconomic reasons to buy the U.S. dollar. Donald Trump has been introducing new tariffs and raising existing ones daily for the past week and a half, so if the U.S. dollar were declining now, it would be entirely logical and expected. However, the price cannot move endlessly in just one direction, and market participants cannot open positions in only one direction every day. That's why we're now observing a correction, which we expect to be followed by a continuation of the six-month uptrend. On the hourly timeframe, the end of the downward trend can be identified by a breakout above the descending trendline.
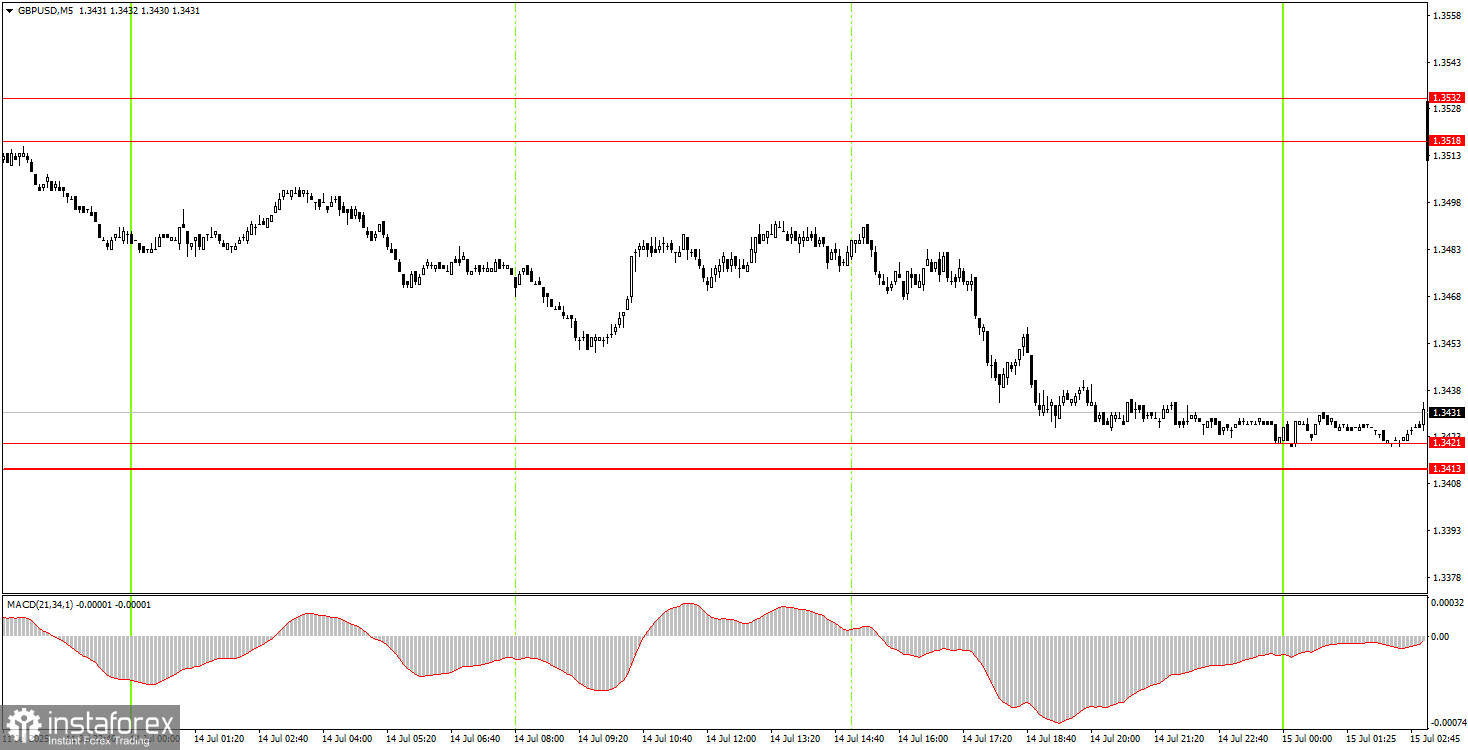
On the 5-minute timeframe, no trading signals were formed on Monday. Only by the end of the day did the price reach the support area of 1.3413–1.3421, from which trading can be considered on Tuesday. A rebound from this area will allow for the opening of long positions, which would be justified from a fundamental analysis perspective. However, today, attention should also be given to the U.S. inflation report, which could potentially trigger a new rise in the dollar, even though this indicator currently has no significant impact on the Fed's monetary policy.
On the hourly timeframe, the GBP/USD pair continues its downward movement, and it's relatively strong. We believe the current decline is a purely technical correction, as there are no fundamental reasons for the dollar to strengthen. Nonetheless, the market can trade based on technical factors alone, and that's what we are witnessing now. Until the price consolidates above the trendline, there are no technical grounds to expect a resumption of the six-month uptrend.
On Tuesday, the GBP/USD pair will need to decide whether to break above or below the 1.3413 level. If this level is broken, the decline will continue based on the same technical factors. A rebound from this level could suggest the end of the downward trend and justify cautious buying.
On the 5-minute timeframe, trading can currently be considered at the following levels: 1.3203–1.3211, 1.3259, 1.3329–1.3331, 1.3413–1.3421, 1.3518–1.3532, 1.3574–1.3590, 1.3643–1.3652, 1.3682, 1.3763, 1.3814–1.3832.
On Tuesday, Bank of England Governor Andrew Bailey is scheduled to speak in the UK, though the event will take place late in the evening. In the U.S., the June inflation report will be released, which could support the dollar, as an increase in the figure is expected.
Support and Resistance Levels: These are target levels for opening or closing positions and can also serve as points for placing Take Profit orders.
Red Lines: Channels or trendlines indicating the current trend and the preferred direction for trading.
MACD Indicator (14,22,3): A histogram and signal line used as a supplementary source of trading signals.
Important Events and Reports: Found in the economic calendar, these can heavily influence price movements. Exercise caution or exit the market during their release to avoid sharp reversals.
Forex trading beginners should remember that not every trade will be profitable. Developing a clear strategy and practicing proper money management are essential for long-term trading success.


