Vea también

 15.07.2025 11:46 AM
On Monday, the EUR/USD pair traded sideways, and overall market activity was very low. Thus, despite the prevailing bearish sentiment, bears failed to push the pair lower. A rebound from the 1.1645 level would favor the euro and a potential rise toward the 127.2% Fibonacci retracement at 1.1712. A breakout above 1.1712 would further support growth toward the 1.1802 level.
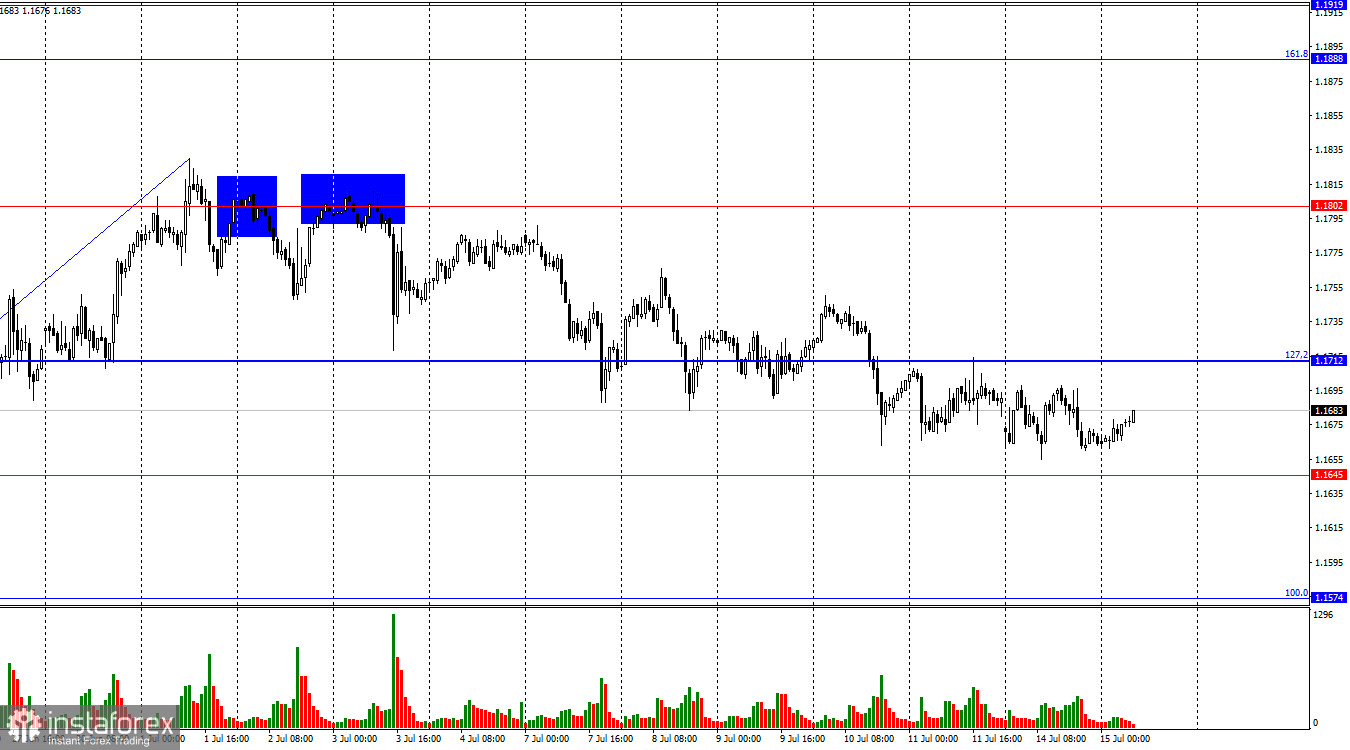
The wave structure on the hourly chart remains simple and clear. The last completed upward wave broke above the previous high, while the new downward wave didn't come close to retesting the prior low. This means the trend remains bullish for now. The lack of real progress in U.S. trade negotiations with its partners, the low probability of trade agreements with most countries, and new tariff hikes continue to present bleak prospects for bears.
On Monday, it became known that Donald Trump has now turned his attention to the European Union. A trade deal with Europe is just as important as with China, given the hundreds of billions of dollars in trade volume between the two economies. Therefore, the U.S. stands to gain significant additional revenues—either through tariffs or a favorable trade agreement. However, Brussels still does not understand Trump's demands or is in no rush to meet them, as Europe's own economic interests are at stake. The three-month negotiation window given by Trump has expired, and the U.S. president has decided to raise tariffs on EU goods to 30%. As with all previous tariffs, these are scheduled to take effect on August 1. This gives the EU a short window to strike a deal. Time is running out. For the euro, the absence of a trade deal is likely more of a positive than a negative, as markets continue to interpret new tariffs as unfavorable for the dollar.
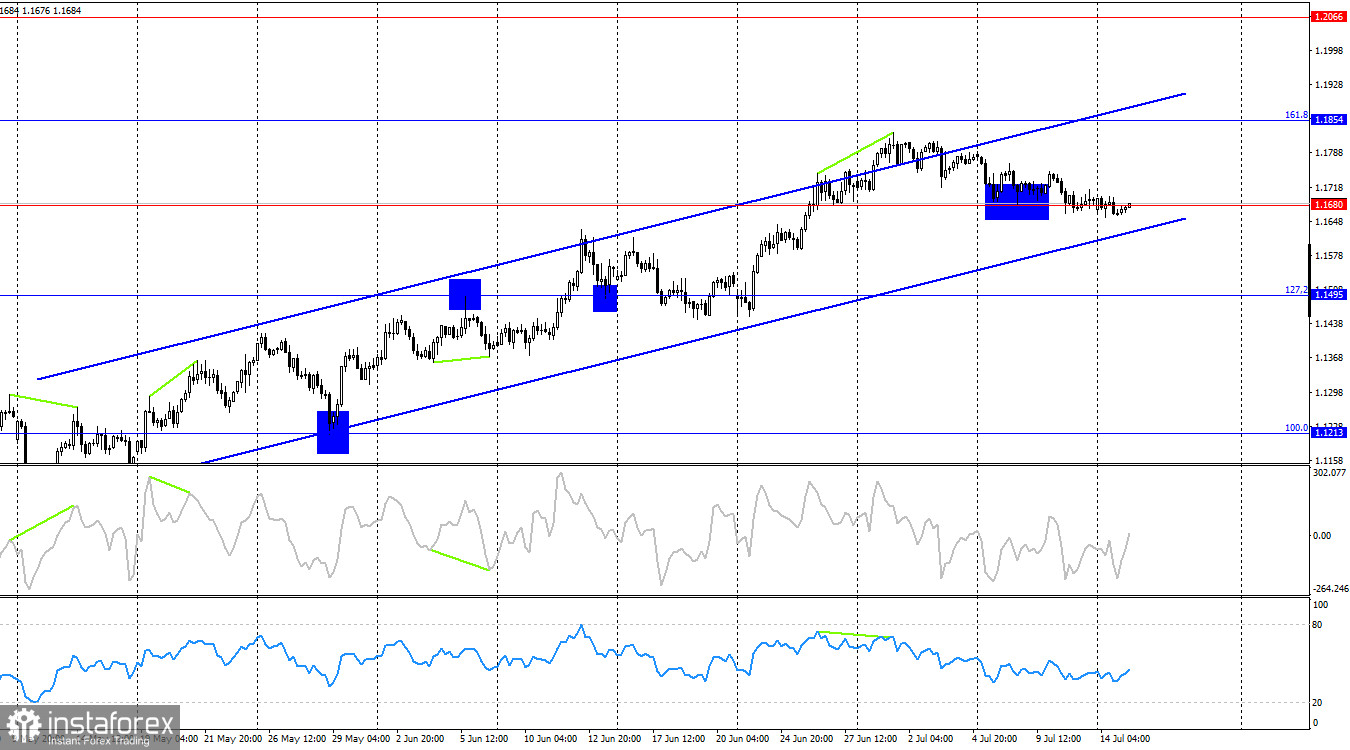
On the 4-hour chart, the pair returned to the 1.1680 level. A rebound from this level would support the euro and a resumption of growth toward the next retracement level at 161.8% – 1.1854. A break below 1.1680 would open the way for further decline toward the lower boundary of the ascending trend channel. A close below the channel would significantly increase the likelihood of a deeper fall for the euro. No emerging divergences are currently visible on any indicators.
Commitments of Traders (COT) Report:
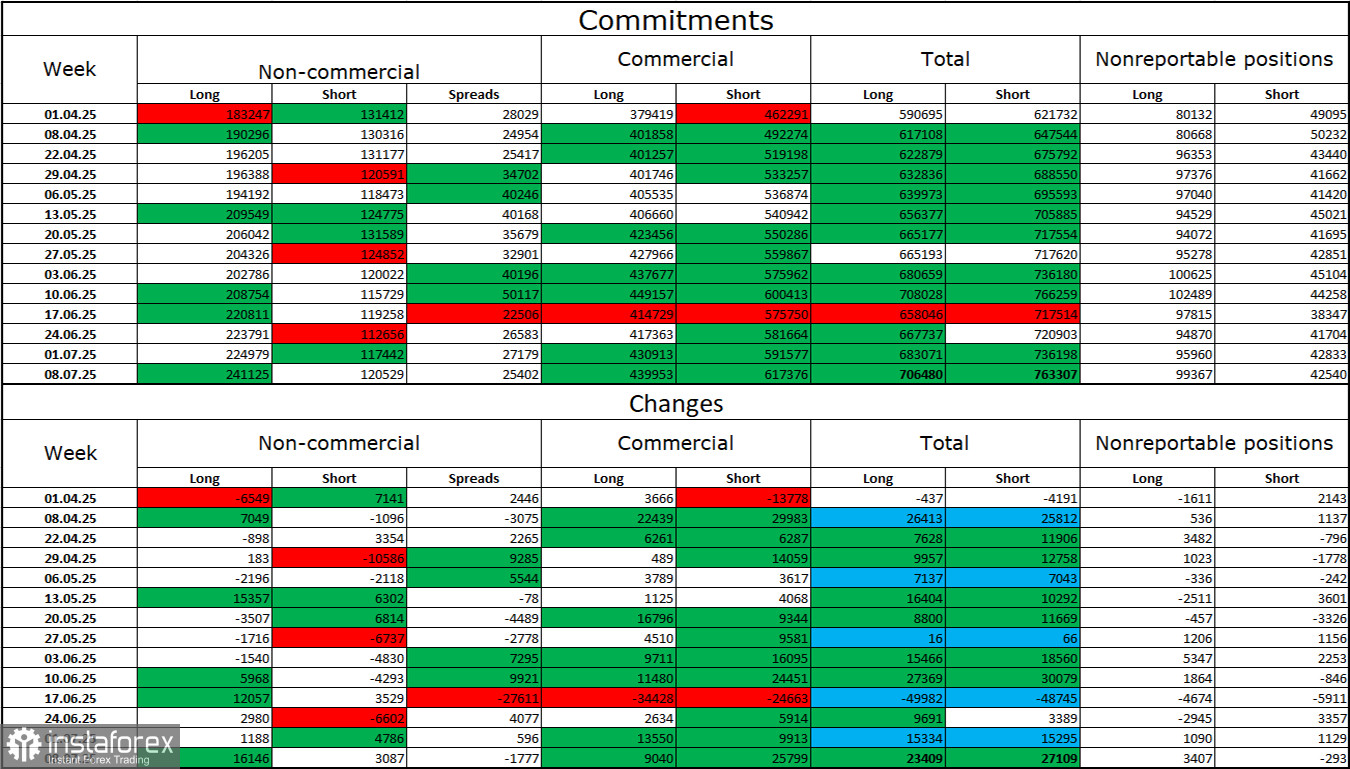
During the latest reporting week, professional traders opened 1,188 new long positions and 4,786 new short positions. The sentiment of the "Non-commercial" category remains bullish, thanks to Donald Trump, and continues to strengthen over time. The total number of long positions held by speculators now stands at 225,000, compared to 117,000 short positions—with the gap (with rare exceptions) consistently widening. This indicates steady demand for the euro, and a lack of interest in the dollar. The situation remains unchanged.
For twenty-two consecutive weeks, major players have been reducing their short positions and increasing their longs. The divergence in monetary policy between the ECB and the Fed remains substantial, but Donald Trump's policies are viewed as the more impactful factor by traders, as they may trigger a recession in the U.S. economy and create numerous other long-term, structural challenges for America.
News Calendar for the U.S. and the Eurozone:
Eurozone – Industrial Production Change (09:00 UTC)U.S. – Consumer Price Index (12:30 UTC)
The July 15 economic calendar includes two entries, one of which is considered important. Market sentiment on Tuesday will be influenced by the news backdrop.
EUR/USD Forecast and Trading Tips:
I would not consider selling the pair today, as recent price action has been too weak and unstable. Buying opportunities may arise on a rebound from the 1.1645 level on the hourly chart, with a target of 1.1712, as bullish positions still appear much more confident than bearish ones. Buying is also possible on a breakout above 1.1712 with a target of 1.1802.
Fibonacci grids are plotted from 1.1574–1.1066 on the hourly chart and from 1.1214–1.0179 on the 4-hour chart.


