Vea también

 15.07.2025 03:34 PM
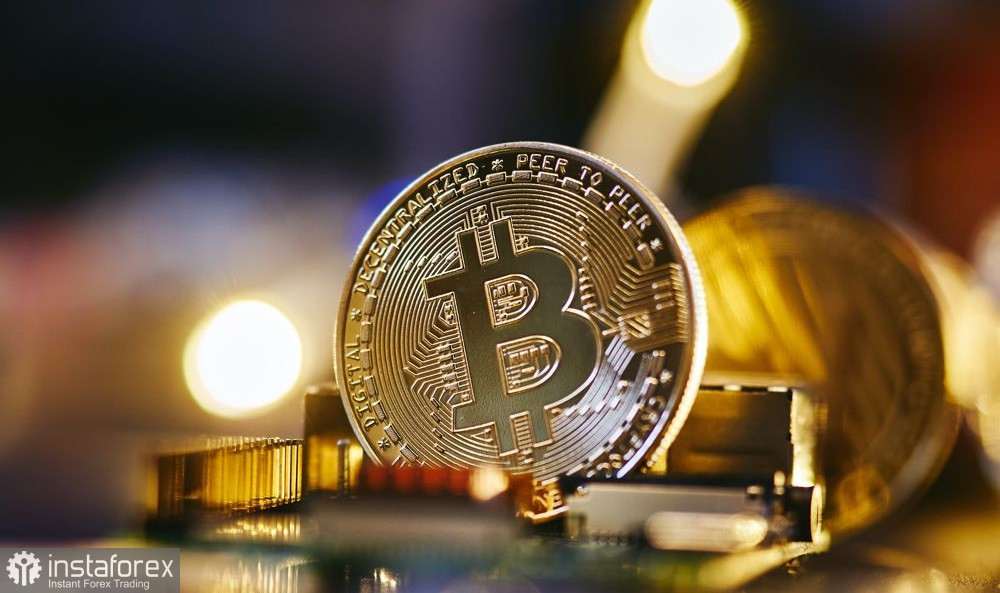
Bitcoin buyers appear to be somewhat confused, as the FOMO currently dominating the market could backfire on those trying to jump on the "last train", — which, in reality, has already turned around and may head back quickly toward the $112,000–$115,000 range.
In the meantime, while everyone is closely watching Bitcoin's movements and the fresh US inflation data, Standard Chartered has announced that it has become the first global bank to offer spot trading in BTC and ETH. This move marks a significant milestone in the integration of digital assets into traditional financial institutions. Offering spot crypto trading by a major bank with a global presence highlights the growing recognition and acceptance of cryptocurrencies as a legitimate asset class.
Standard Chartered's decision reflects increasing demand from institutional investors for access to digital assets. By enabling direct buying and selling of BTC and ETH, the bank aims to meet this demand and strengthen its position in the digital asset market. This step is expected to attract new clients and boost trading volumes.
While this development goes beyond Standard Chartered's typical operations, it could serve as a catalyst for other major banks and financial institutions to follow suit and begin offering similar services. In turn, this may lead to further growth in liquidity and market stability for cryptocurrencies.
Trading recommendations
Bitcoin Technically, buyers are currently targeting a return to the $117,600 level, which opens a direct path to $120,000 — and from there, it's just a short leap to $121,300. The ultimate target is the high around $122,000; breaking above it would signal a strengthening bull market. In case of a decline, buyers are expected at $116,300. A drop below this area could quickly push BTC toward $114,900, with $113,600 as the most distant target.
Ethereum Clear consolidation above $2,985 opens the way to $3,028. The furthest upside target is the high around $3,072; a breakout above this would indicate renewed buyer interest. If Ethereum falls, buyers are expected at $2,941. A move below this level could quickly drag ETH down toward $2,894, with $2,857 as the most distant support level.
What's on the chart
Price testing or crossing any of these moving averages often either halts movement or injects fresh momentum into the market.


