Vea también

 17.07.2025 07:41 AM
Historically, investor flight from the stock market has inevitably been reflected in a decline of the EUR/JPY pair, as it sums up the exit from risk currencies (such as the euro) in favor of safe havens (like the dollar and the yen). As a result, panic in the markets typically translates into an accelerated drop in EUR/JPY. And now seems to be just such a time.
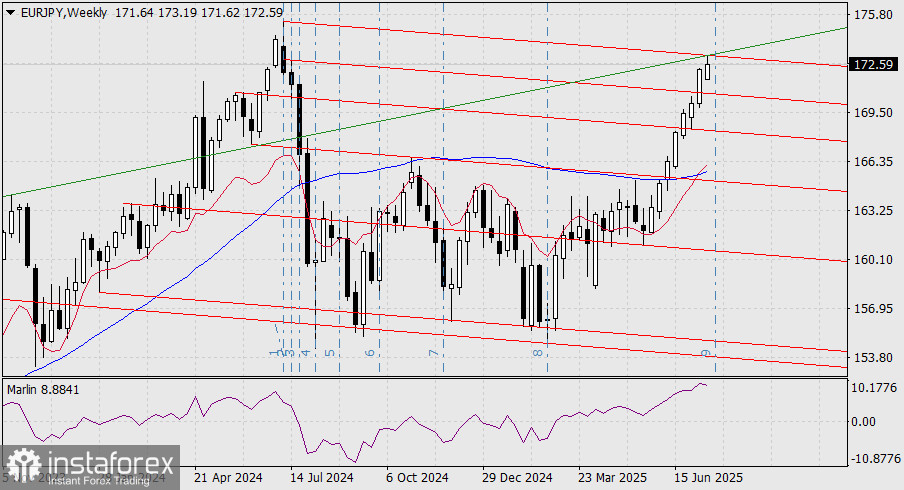
On the weekly chart, the price has reached a strong channel line that originates from May 2020 (green line). In addition, a descending price channel (in red) appears to have formed, with the current week's high serving as the upper boundary.
Next week, starting July 21, coincides exactly with the 9th Fibonacci time line—a strong reversal marker. The Marlin oscillator is turning downward.
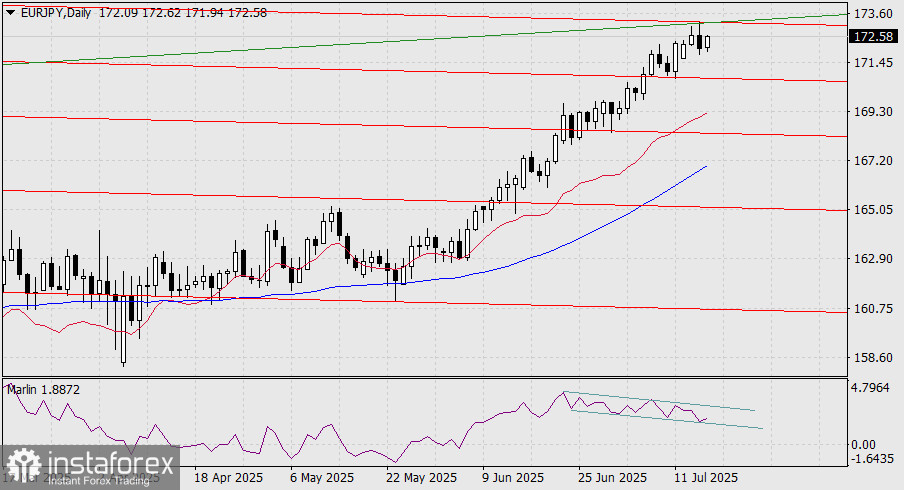
On the daily chart, multiple weak divergences have formed. At the same time, the Marlin oscillator's signal line is declining within its own descending channel, which introduces ambiguity depending on the direction in which the line exits the channel. In any case, if the price fails to break above yesterday's high at 173.19, the reversal sentiment will remain intact. However, if the 173.19 level is breached, the entire reversal setup will be invalidated.
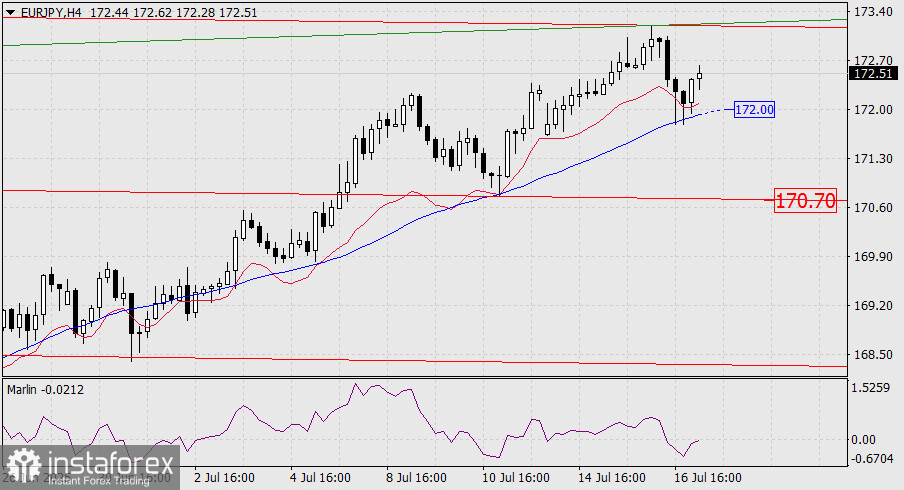
On the four-hour chart, the Marlin oscillator has already entered the territory of a downward trend. If the price consolidates below the MACD line, beneath 172.00, the next target along the inner red channel line at 170.70 will open up. And now the big question: what will fall first—S&P 500 or EUR/JPY?
You have already liked this post today
*El análisis de mercado publicado aquí tiene la finalidad de incrementar su conocimiento, más no darle instrucciones para realizar una operación.


