Vea también

 28.07.2025 08:25 AM
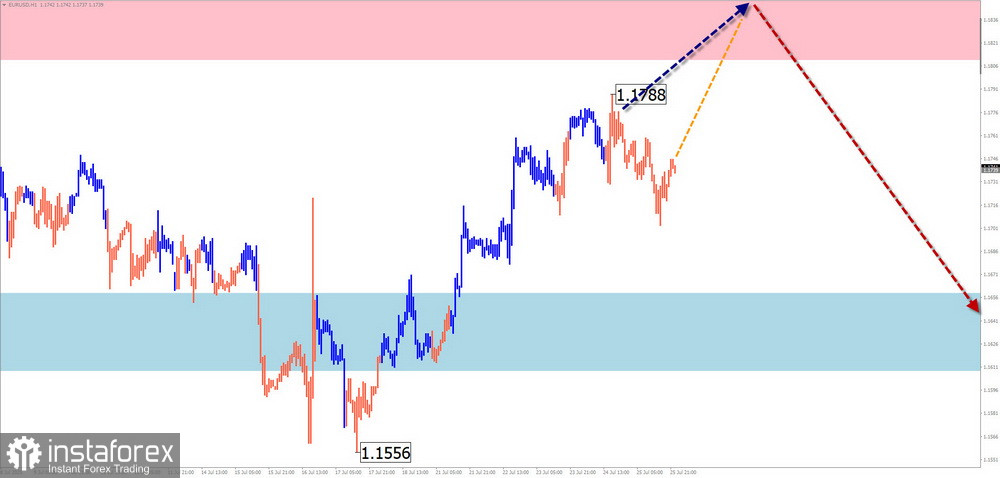
GBP/USD
Analysis:The British pound continues to move in the upper part of the price chart, in line with the prevailing upward trend. Throughout the current month, prices have formed a corrective pullback from a strong resistance zone. The wave structure resembles a contracting flat and remains incomplete at the time of analysis.
Forecast:The pair is expected to continue its current downward correction within the support area. Sideways movement with price testing resistance is possible early in the week. A reversal and renewed decline may occur by the end of the week.
Potential Reversal Zones:
Recommendations:
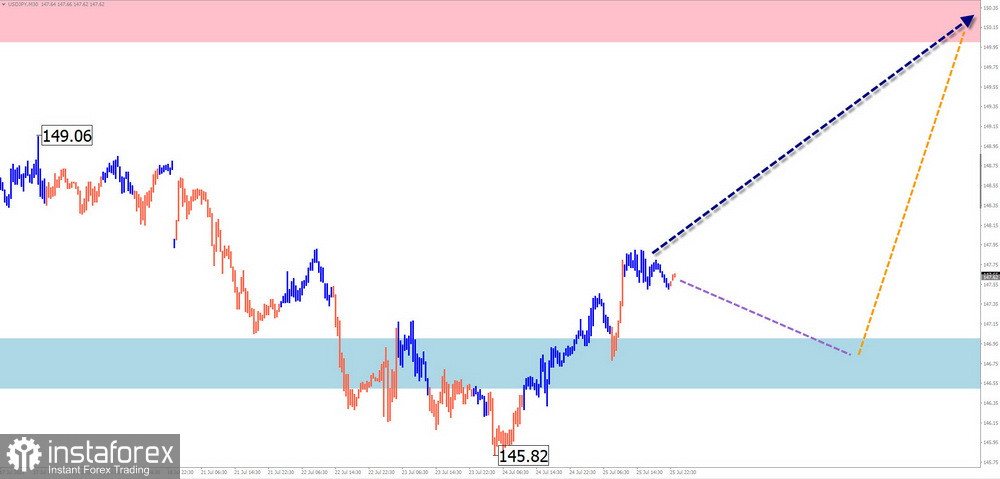
AUD/USD
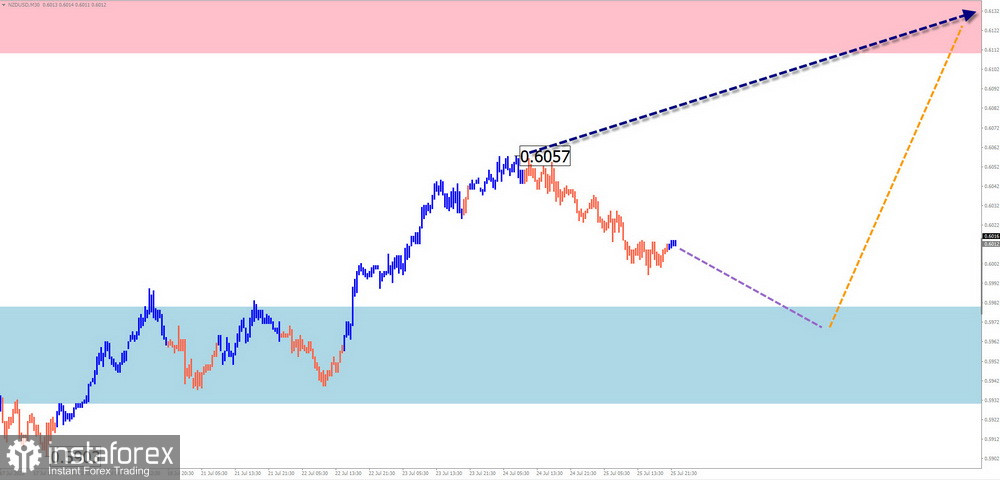
Analysis: Since April of last year, the Australian dollar has predominantly moved upward. The current incomplete trend began on June 23. Over the past month, a corrective pullback has been forming within this trend as a contracting flat, which remains incomplete.
Forecast: A continuation of the general downward correction is expected early in the week, reaching the support area. Afterward, a bullish reversal is anticipated. The upper boundary of the week's expected range is defined by the projected resistance.
Potential Reversal Zones:
Recommendations:
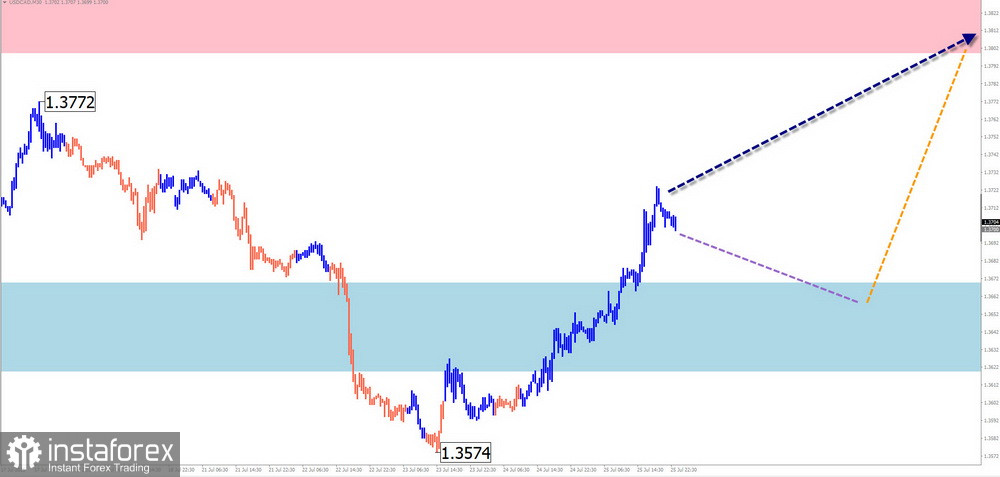
USD/CHF
Analysis: In the main Swiss franc pair, a dominant downtrend has brought prices to the upper boundary of the current wave's target zone. The movement has entered its final stage, with sideways trading observed in the past week. There are no immediate reversal signals on the chart.
Forecast: Continued downward movement is expected, potentially reaching support. A temporary rebound toward resistance is possible early in the week. A reversal may form in this area, increasing the likelihood of a downward move by week's end.
Potential Reversal Zones:
Recommendations:
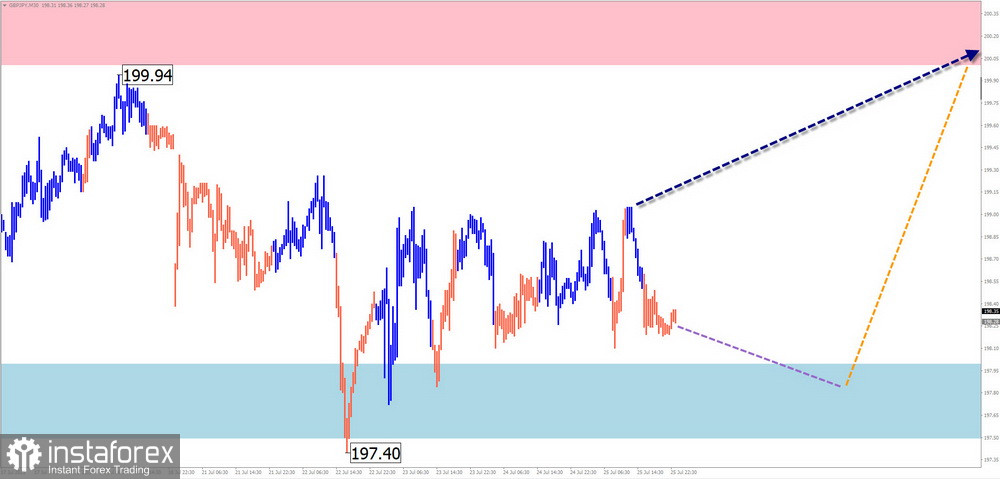
EUR/JPY
Analysis: The EUR/JPY pair has been in an upward wave structure since February. The wave is nearing completion. Last week, the pair broke through an intermediate resistance level, which now serves as support. The final segment of the wave is still missing.
Forecast: Sideways movement along support is likely early in the week. A bullish continuation is more probable toward the end of the week. Projected resistance marks the upper boundary of the week's expected range.
Potential Reversal Zones:
Recommendations:
AUD/JPY
Analysis: The AUD/JPY pair has followed an upward flat pattern since August of last year. The final portion of this wave structure has been forming since April and remains incomplete. Two weeks ago, the price broke above a resistance level and has been consolidating above it.
Forecast: A downward move toward the support zone is likely at the beginning of the week. Toward the weekend, the probability of a bullish reversal increases.
Potential Reversal Zones:
Recommendations:
US Dollar Index
Analysis: The U.S. dollar index has followed a bearish wave algorithm since February. Over the past three weeks, prices have formed an upward correction from a strong support zone, which remains incomplete. The index is currently within a key reversal area.
Forecast: A sideways move along the support zone is likely in the first few days, possibly testing its lower boundary. A temporary decline below support cannot be ruled out. In the second half of the week, a bullish reversal and return to upward movement are more likely.
Potential Reversal Zones:
Recommendations: In the coming days, consider closing long positions in major currency pairs. A bet on weakening other currencies (strengthening USD) may prove successful if reversal signals confirm in the support zone.
Note: In simplified wave analysis (SWA), all waves consist of three parts (A–B–C). Only the most recent incomplete wave is analyzed for each timeframe. Solid arrow fills indicate formed wave structures; dashed lines indicate expected movements.
Caution: The wave algorithm does not account for the time duration of instrument movements.


