Vea también

 04.08.2025 11:38 AM
Trend Analysis
This week, the price from the level of 1.3278 (closing of the last weekly candle) may begin an upward movement toward the target of 1.3389 – the 23.6% retracement level (red dashed line). Upon testing this level, the price may continue moving upward toward the target of 1.3540 – the 14.6% retracement level (red dashed line).
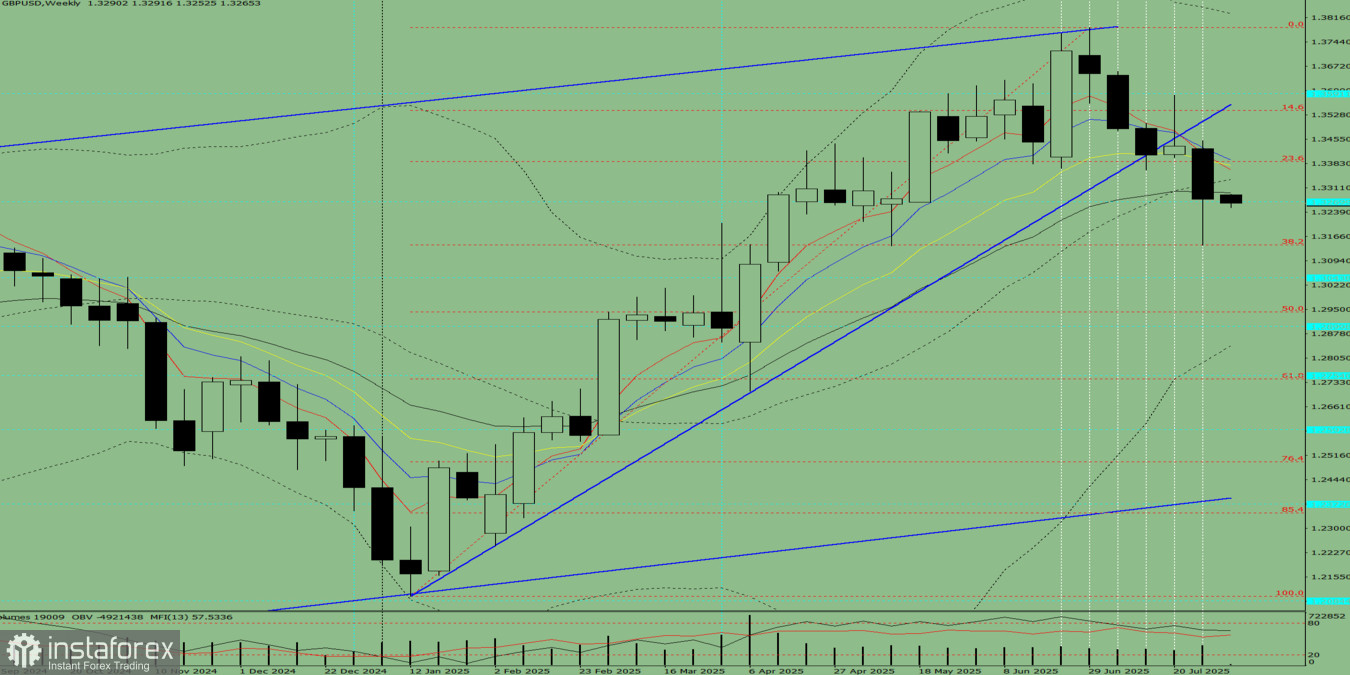
Fig. 1 (Weekly Chart)
Comprehensive Analysis:
Conclusion of the comprehensive analysis: upward trend.
Overall forecast for the GBP/USD weekly candle: The price will most likely show an upward trend throughout the week, with the weekly white candle having a lower shadow (Monday – downward movement) and an upper shadow (Friday – downward movement).
Alternative Scenario: From the 1.3278 level (closing of the last weekly candle), the price may start an upward movement toward the target of 1.3389 – the 23.6% retracement level (red dashed line). Upon reaching this level, a downward movement toward 1.3377 – the 13-period EMA (yellow dashed line) is possible.
You have already liked this post today
*El análisis de mercado publicado aquí tiene la finalidad de incrementar su conocimiento, más no darle instrucciones para realizar una operación.


