Vea también

 21.08.2025 05:50 AM
Bitcoin (BTC)
The reversal of Bitcoin from its all-time high coincided with the decline of the Nasdaq technology index. This is a clear sign of investors moving away from risk, and we believe that this new trend will continue (see the S&P 500 review from August 19).
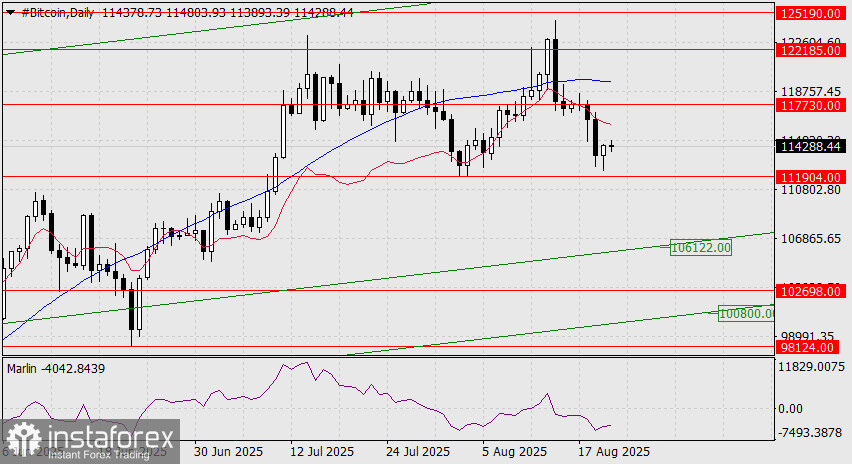
The nearest target for Bitcoin on the daily chart is the support level of 111,904, which was not reached yesterday. Breaking through this support will open the way to the next level at 106,122 — the embedded line of the green upward price channel. The Marlin oscillator is not yet signaling a reversal to the upside. The MACD line is shifting direction from upward to downward.
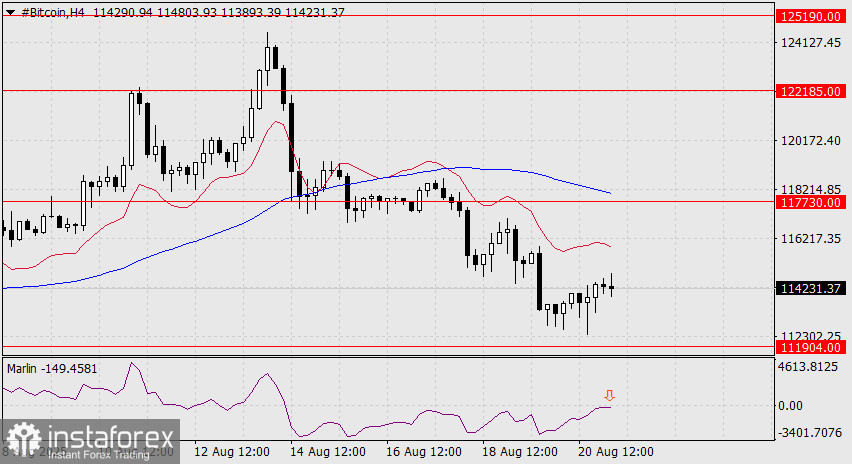
On the H4 chart, the oscillator is turning down from the zero neutral line. The MACD line also shows a strong intention to continue the downward movement. Therefore, we expect the price to consolidate below the nearest support level at 111,904.
You have already liked this post today
*El análisis de mercado publicado aquí tiene la finalidad de incrementar su conocimiento, más no darle instrucciones para realizar una operación.


