Vea también

 22.08.2025 06:45 AM
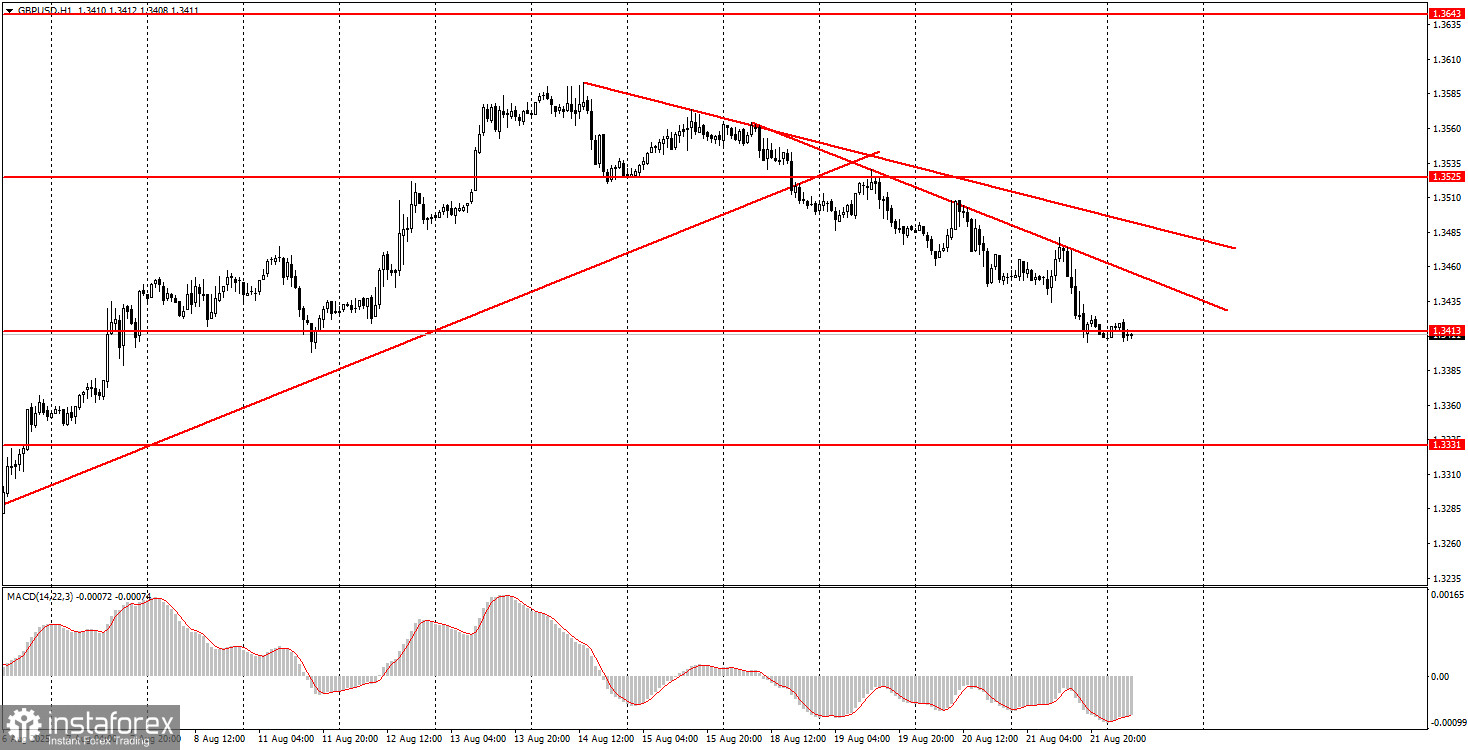
On Thursday, the GBP/USD pair continued a mild downward movement, supported by two descending trendlines. The downward correction in the pound looks clearer, which makes the British currency more preferable for trading. Yesterday, business activity indices for August were published in the UK for the services and manufacturing sectors. However, a day earlier, a much more significant inflation report was released, which surprisingly failed to trigger a logical market reaction. The British pound rose briefly but then continued its technical corrective move. As for the UK business activity indices, they contradicted each other in the same way as the European ones. Only the US data triggered a natural market move, since all three reports aligned in character. Thus, the correction continues, but the main upward trend remains in place. Therefore, we expect the correction to end and growth to resume.
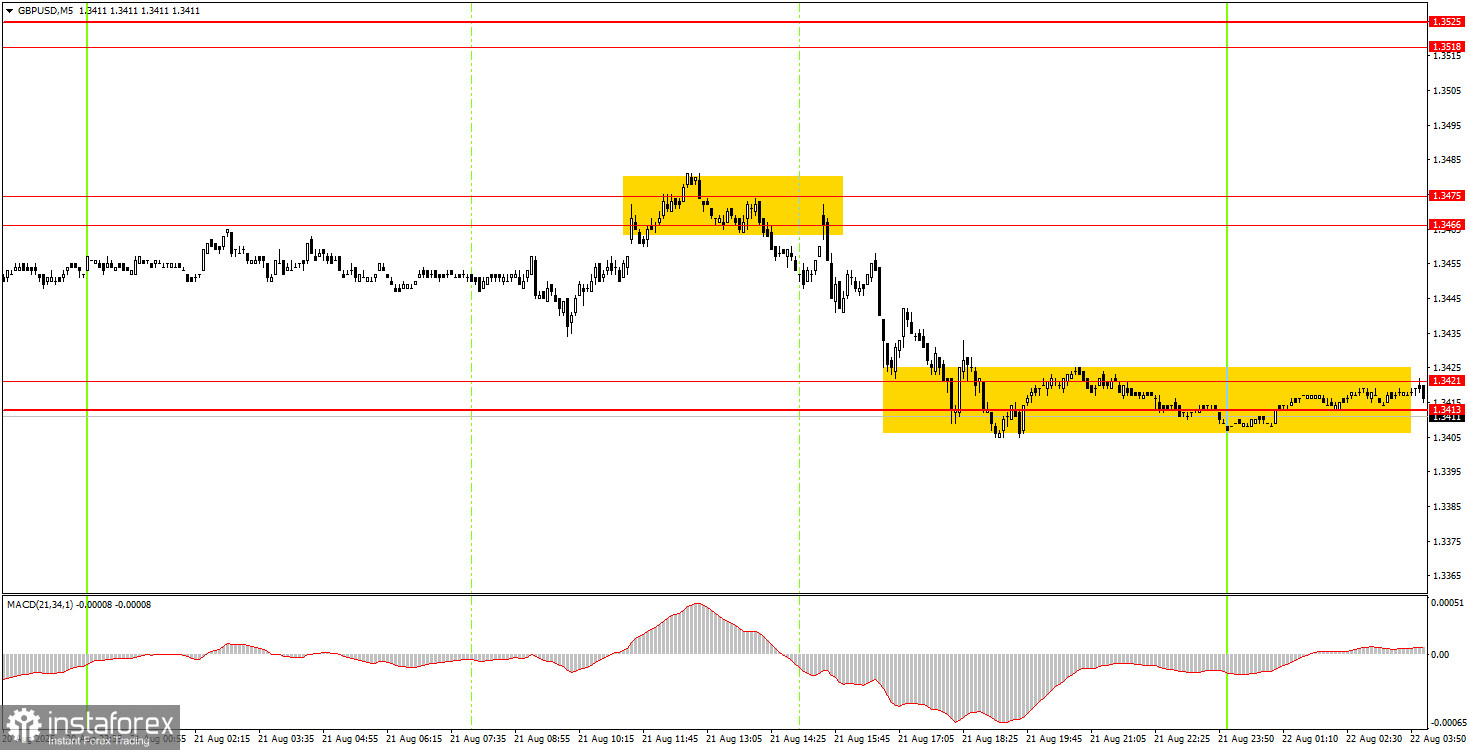
On the 5-minute timeframe, two trading signals were formed on Thursday. The second one was not a signal but simply a test of the 1.3413–1.3421 area. There was neither a rebound nor a breakout from this area. Therefore, beginners could only trade the rebound from the 1.3466–1.3475 area. This rebound was not the most precise, but still allowed opening short positions. The profit on shorts could reach about 40 pips, and the pair's decline was seen only thanks to US reports.
On the hourly timeframe, GBP/USD shows that the short-term downward trend remains. We believe this is only another correction, as the fundamental and macroeconomic background has not become more favorable for the dollar recently. Since there are very few macroeconomic and fundamental events this week, trading can be based on the technical picture. However, we still do not expect a strong decline in the pair.
On Friday, the GBP/USD pair may well resume its upward movement, as the correction could end at any moment. Trading (if there is such a desire under the current volatility) can be done today from the 1.3413–1.3421 area.
On the 5-minute timeframe, the following levels can currently be used for trading: 1.3102–1.3107, 1.3203–1.3211, 1.3259, 1.3329–1.3331, 1.3413–1.3421, 1.3466–1.3475, 1.3518–1.3532, 1.3574–1.3590, 1.3643–1.3652, 1.3682, 1.3763. On Friday, no events or reports are scheduled in the UK, while in the US, Federal Reserve Chair Powell's speech will take place in the evening. Powell's speech is not only the key event of the day but of the entire week. It may well turn the market around 180 degrees.
Support and Resistance Levels: These are target levels for opening or closing positions and can also serve as points for placing Take Profit orders.
Red Lines: Channels or trendlines indicating the current trend and the preferred direction for trading.
MACD Indicator (14,22,3): A histogram and signal line used as a supplementary source of trading signals.
Important Events and Reports: Found in the economic calendar, these can heavily influence price movements. Exercise caution or exit the market during their release to avoid sharp reversals.


