Vea también

 27.08.2025 03:57 AM
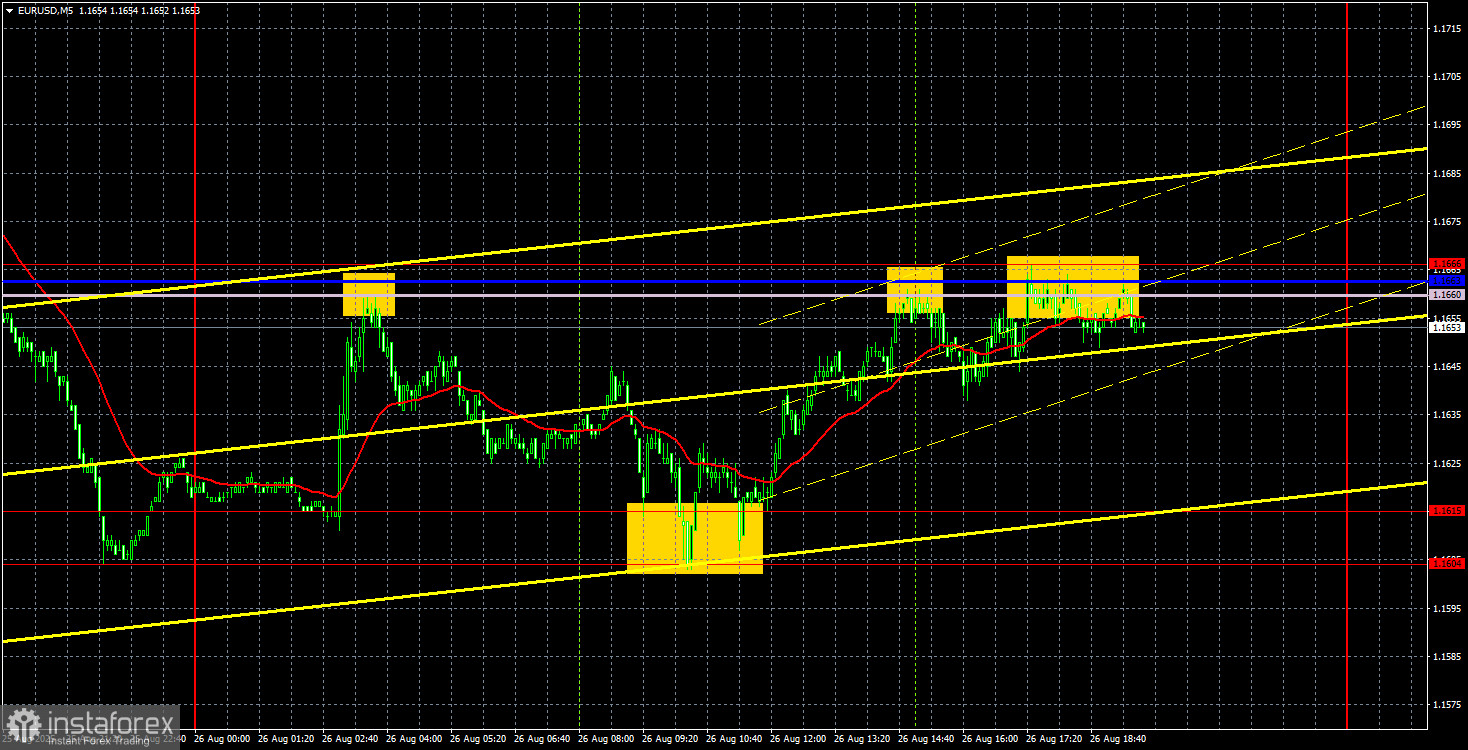
On Tuesday, the EUR/USD currency pair was trading between the 1.1604 and 1.1615 areas, with the Ichimoku indicator lines in play. Thus, we can talk about a local flat. This flat can end quickly, but in any case, traders need a breakout of the sideways channel through one of its borders. Naturally, we expect an exit through the upper boundary, as this would signal a resumption of the uptrend and a renewed decline in the dollar. From our point of view, there are no reasons for the dollar to rise (other than technical, corrective ones). Each new day brings more "surprises" for the American currency. For example, yesterday it was reported that orders for durable goods declined for the second consecutive month. Although the actual value was not as bad as some forecasts, the report cannot be called positive for the dollar.
In addition, Donald Trump has decided to fire another member of the Federal Reserve's Monetary Committee—Lisa Cook. Tension over the Fed's activity and independence is yet another bearish factor for the dollar. Technically, the price has broken through the trend line, so a new upward trend is now forming. It will remain in place as long as the price doesn't fall below the 1.1604-1.1615 area. A consolidation above the Ichimoku indicator lines will signal the logical resumption of euro growth.
On the 5-minute timeframe, the price bounced off the channel's boundaries three times yesterday. Traders could have responded to each of those signals, and each trade either delivered a small profit or was closed at breakeven.
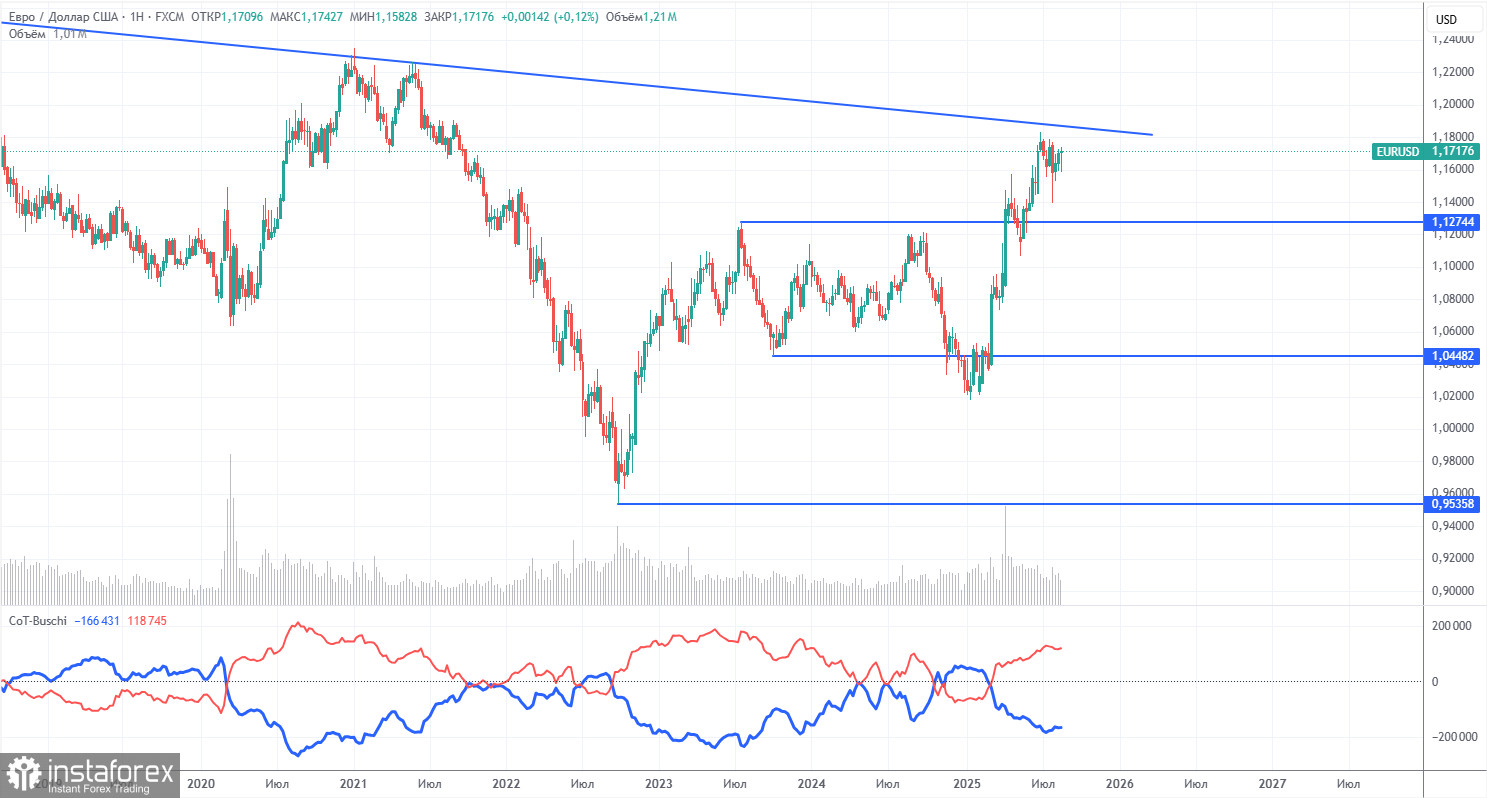
The latest COT report is dated August 19. The chart above clearly shows that the net position of non-commercial traders had long been bullish, while bears only briefly gained dominance at the end of 2024 before quickly losing it again. Since Donald Trump assumed the U.S. presidency, the dollar has been the only currency in decline. We cannot say with 100% certainty that this will continue, but current global developments strongly point in that direction.
We still see no fundamental factors supporting the euro's rise, but there remain plenty of factors weighing on the dollar. The global downtrend in the U.S. currency continues, and what does it matter now where the price moved in the past 17 years? Once Trump ends his trade wars, the dollar may rise again, but recent events show the wars will persist in one form or another.
The positions of the red and blue lines on the indicator continue to signal a bullish trend. During the last reporting week, long positions among the "Non-commercial" group increased by 6,400, while shorts rose by 3,100. As a result, the net position rose by 3,400, a minor change.
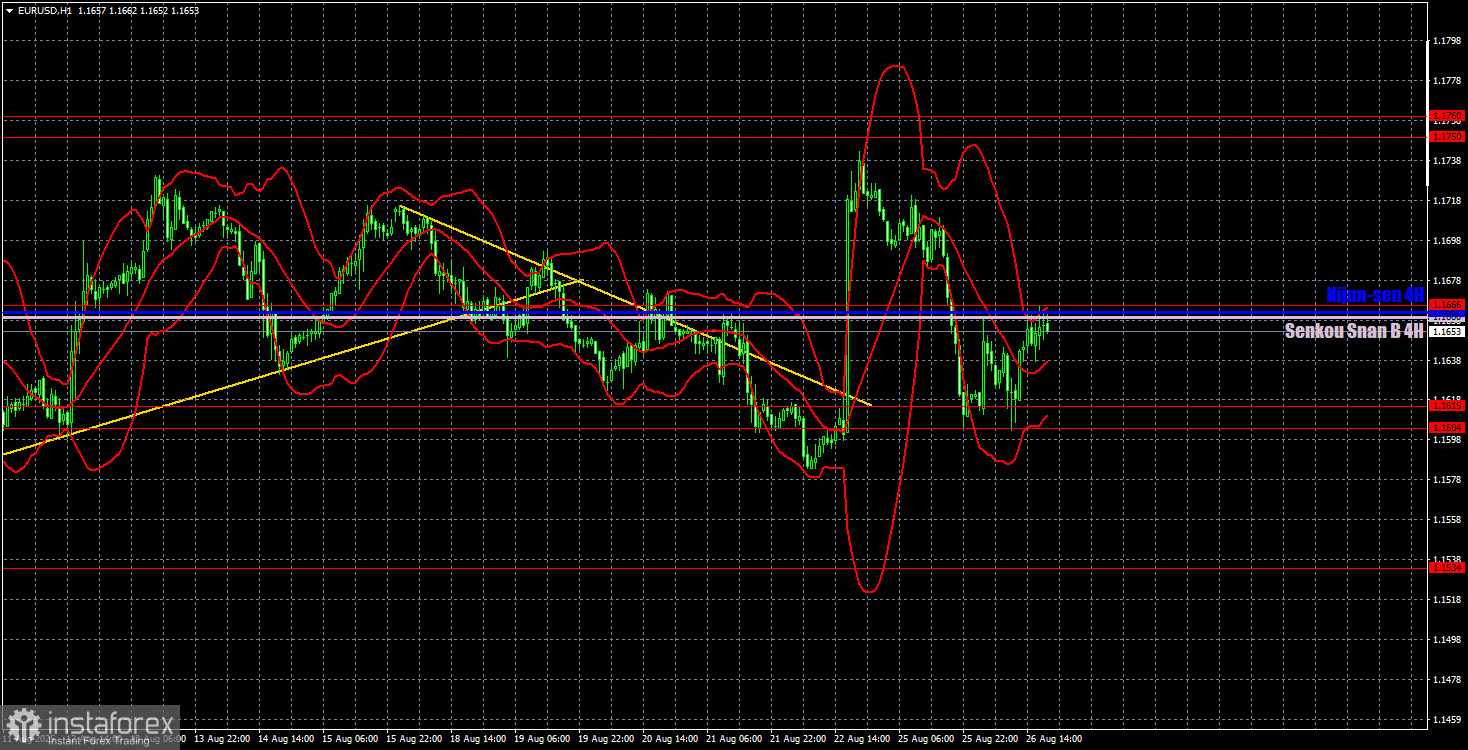
In the hourly time frame, EUR/USD made its first step toward forming a new upward trend, but so far, this is just one step. The global factors behind the dollar's decline, which we have been mentioning, remain unchanged. We still do not see any grounds for a medium-term dollar rally, and now, from a technical perspective, the trend is upward on almost all timeframes. The dollar cannot move in one direction every day, so pauses are normal.
For August 27, we highlight the following trading levels — 1.1092, 1.1147, 1.1185, 1.1234, 1.1274, 1.1362, 1.1426, 1.1534, 1.1604-1.1615, 1.1666, 1.1750-1.1760, 1.1846-1.1857, as well as the Senkou Span B line (1.1660) and Kijun-sen line (1.1663). The Ichimoku indicator lines may move during the day, so this should be taken into account when determining trading signals. Don't forget to place the Stop Loss at breakeven if the price moves 15 pips in the right direction. This will help protect against potential losses if the signal turns out to be false.
On Wednesday, there are no important events or reports scheduled in either the US or the Eurozone. Thus, there will be nothing to react to during the day, volatility could again be low, and there may be no intraday trend.
On Wednesday, upward movement could well resume, but this would require breaking through the Senkou Span B and Kijun-sen lines. In this case, we would expect a rise toward the 1.1750-1.1760 area.


