Vea también

 15.09.2025 12:02 PM
Trend analysis.
This week, from the level of 1.3556 (the closing of the last weekly candle), the price may continue moving upward toward 1.3787 – the upper fractal (red dashed line). Upon testing this level, the price may retrace downward toward 1.3658 – the upper fractal (weekly candle of July 6, 2025).
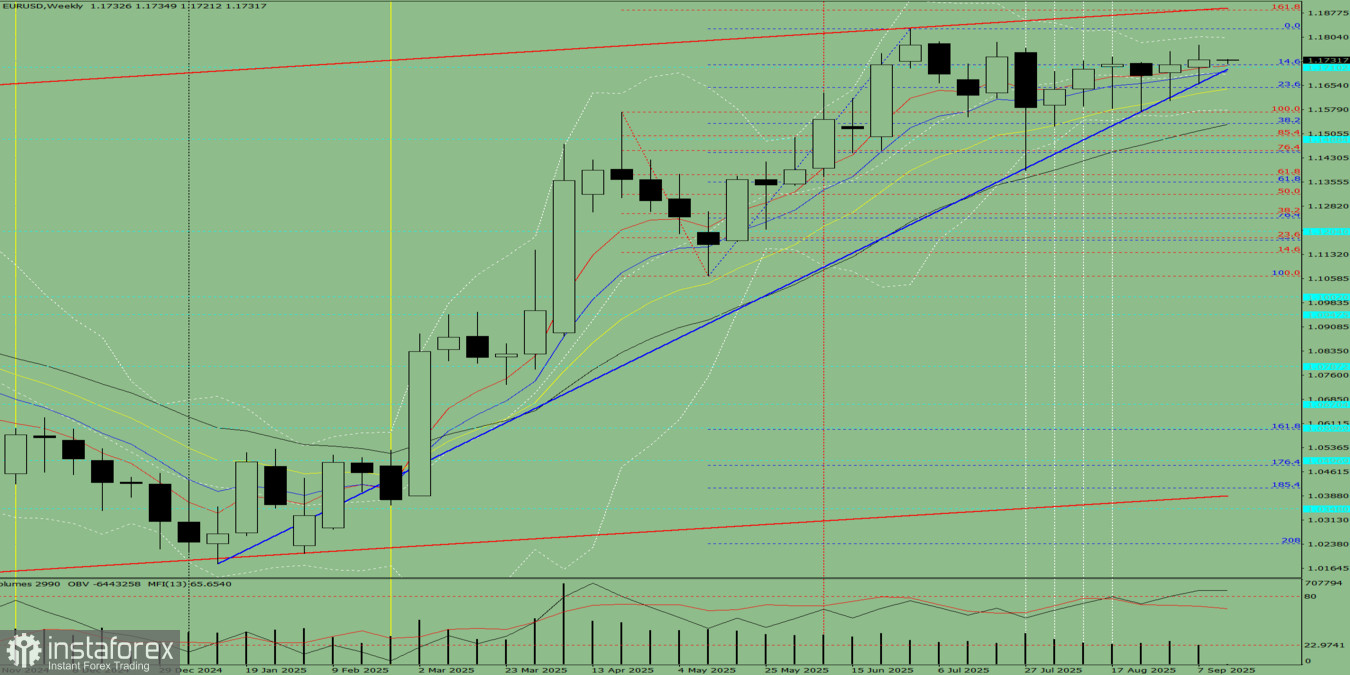
Fig. 1 (weekly chart).
Comprehensive analysis:
Conclusion from comprehensive analysis: upward trend.
Overall summary of GBP/USD weekly candle calculation: during the week, the price is most likely to show an upward trend with the absence of a lower shadow on the weekly white candle (Monday – upward) and the presence of an upper shadow (Friday – downward).
Alternative scenario: from the level of 1.3556 (the closing of the last weekly candle), the price may continue moving upward toward 1.3658 – the upper fractal (weekly candle of July 6, 2025). Upon reaching this level, the price may then move downward toward 1.3579 – the historical support level (blue dashed line).
You have already liked this post today
*El análisis de mercado publicado aquí tiene la finalidad de incrementar su conocimiento, más no darle instrucciones para realizar una operación.


