Vea también

 05.11.2025 11:57 AM
On Wednesday, from the 1.1481 level (yesterday's daily close), the market may begin moving upward toward 1.1516, the 76.4% retracement level (blue dotted line). Upon testing this level, the price may then pull back downward toward 1.1472, the historical support level (blue dotted line).
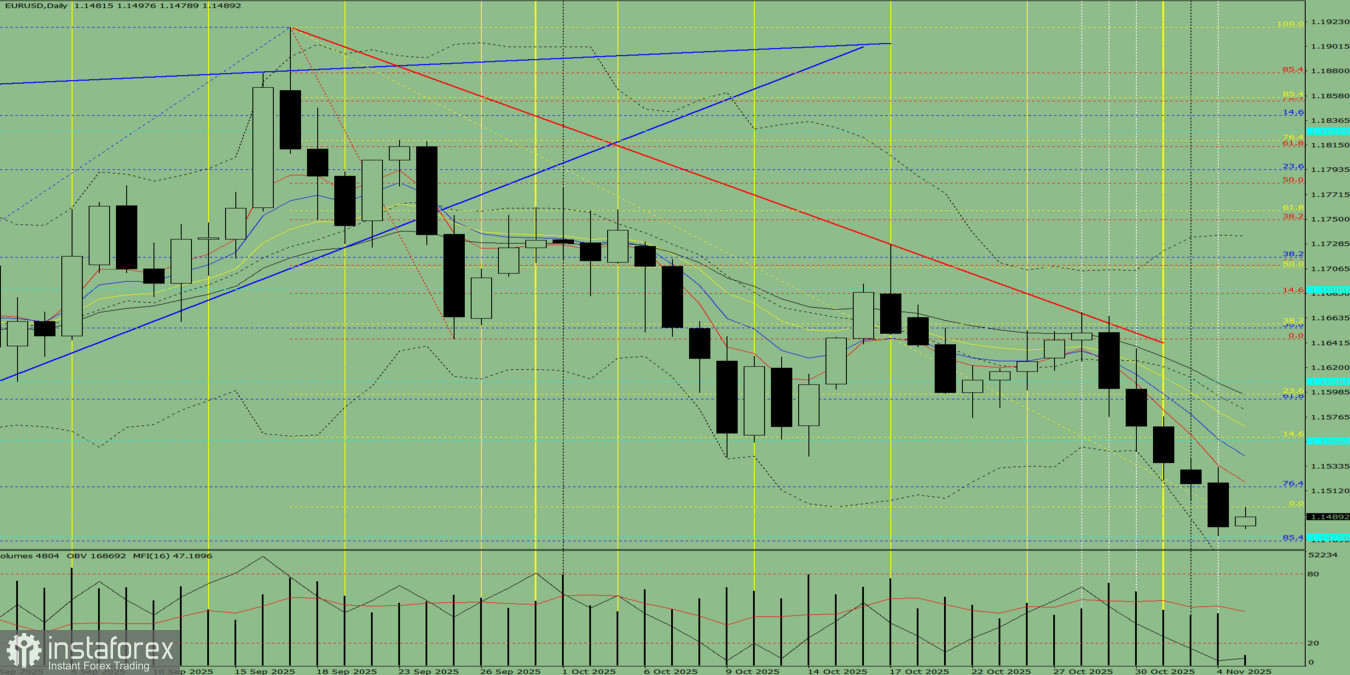
Fig. 1 (Daily Chart)
Overall conclusion: upward trend.
Alternative scenario: From the 1.1481 level (yesterday's daily close), the price may begin moving upward toward 1.1542, the 8-period EMA (thin blue line). Upon testing this line, the price may then pull back downward toward 1.1516, the 76.4% retracement level (blue dotted line).
You have already liked this post today
*El análisis de mercado publicado aquí tiene la finalidad de incrementar su conocimiento, más no darle instrucciones para realizar una operación.


