
Vea también


 03.09.2026 05:02 AM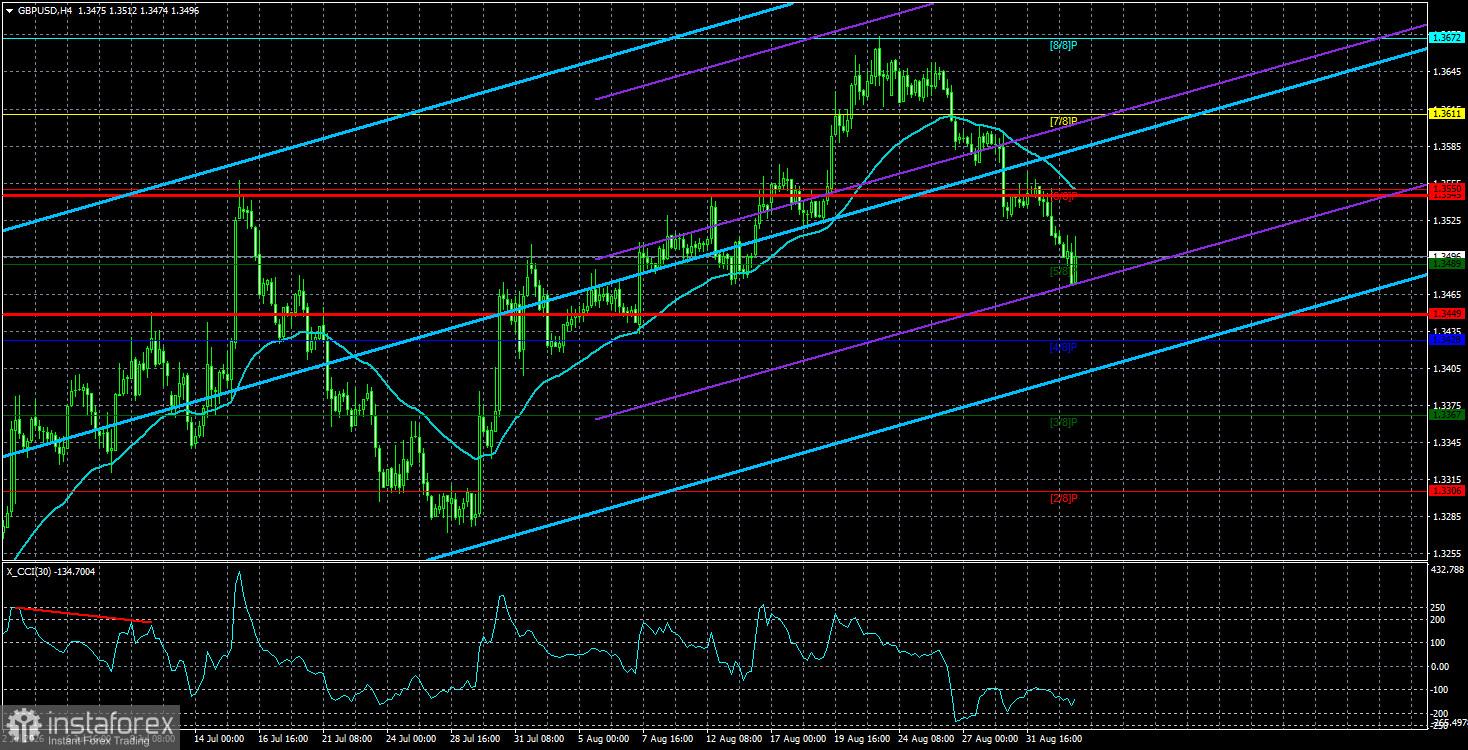
The GBP/USD currency pair continued moving south on Wednesday. The worst part of this move is that, in the near term, the British pound could again fall toward the 1.3200 area for no obvious reason. This article is not about local macro releases that do not affect the overall trend. It is about global processes and the technical picture.
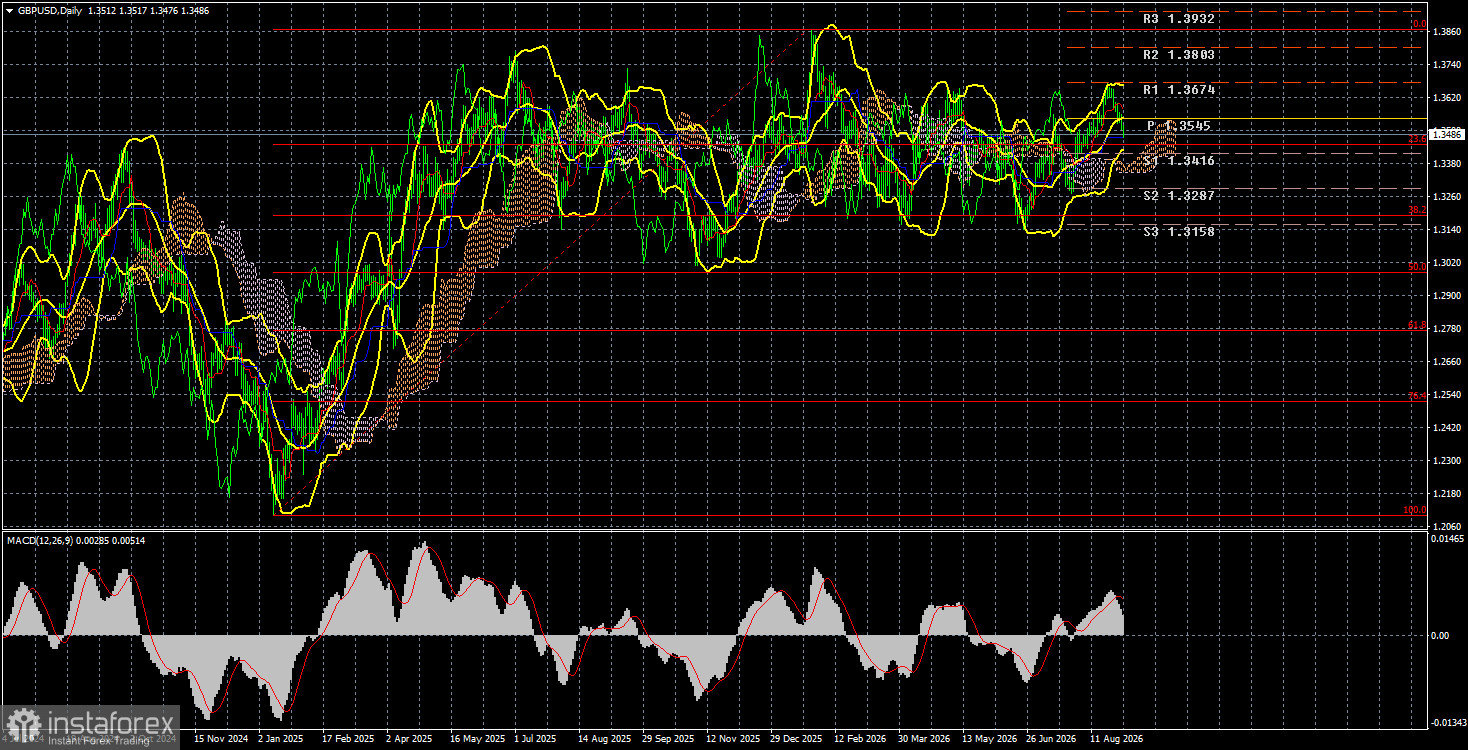
Looking at the daily chart and zooming out substantially makes it clear that, since around June last year, the GBP/USD pair has been trading in a range. Yes, a range is not necessarily a matter of days or weeks — sometimes it can last for years. Look closely at the chart below. In the past 14 full months, the pound has left the 1.3150–1.3750 band only twice, and both times for literally a few days. What is that if not a sideways channel? Suppose we are dealing with a long-term range. It is then reasonable to assume that global factors led to the formation of this range. The market does not know which direction to trade next, so it makes no sustained attempt to leave the channel. And what is the most important global factor over the past year? Uncertainty.
Global uncertainty is the key reason why neither the dollar, the euro, nor the pound can start a trend. Market participants do not understand what to expect next. A war with Iran could last years — who can say it won't? Look at events in Ukraine, which many initially expected to be over in a couple of months. At the same time, the Iran conflict could end at any moment; nobody knows when Trump might wake up in a good mood and decide that it is enough.
Geopolitical uncertainty breeds monetary uncertainty. Because inflation readings depend on oil prices, which swing wildly and can collapse or soar, the market cannot predict how central banks will act. With the European Central Bank or the Bank of England, you can still form a reasonably coherent forecast, but with the Federal Reserve it has become almost impossible. Too many factors must be taken into account, and Kevin Warsh's new approach to Fed communications has removed almost all market cues.
And then there is the Trump factor. No one knows when the U.S. president will decide to start a new war, see an injustice to America somewhere, sack another Fed official, or launch a new trade war. The market does not know what to expect from Trump and, until he causes fresh trouble, prefers not to force events in the FX market. As 2026 showed, Trump can make decisions that cause the dollar to strengthen — a result few expected at the start of the year. But Trump started a conflict with Iran, and the dollar strengthened, even if the White House did not want that outcome.
Therefore, the pound may fall again to the 1.3200 area simply because the long-term flat persists.
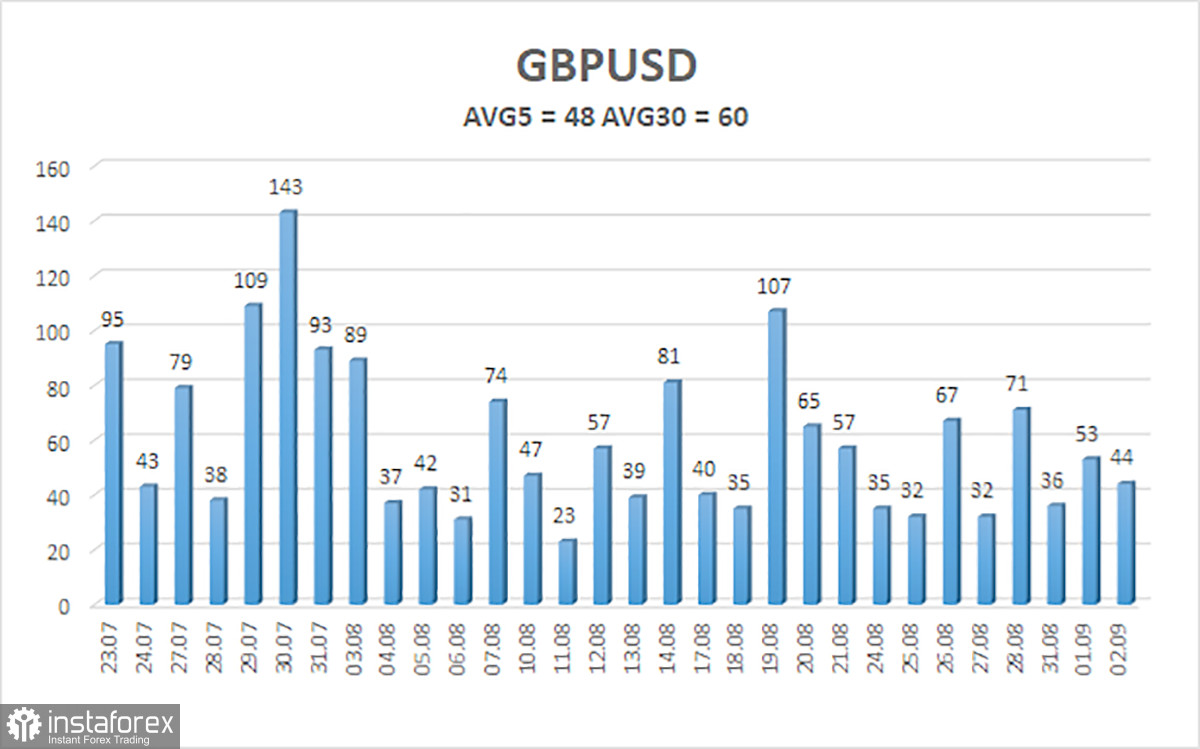
The average volatility of the GBP/USD pair over the last 5 trading days is 48 pips, which is considered "low" for the pound/dollar. On Thursday, September 3, we therefore expect the pair to move within a range bounded by 1.3449 and 1.3545. The higher channel of the linear regression has turned upward, indicating an uptrend. The CCI indicator has entered oversold territory, signaling a possible end to the correction.
S1 – 1.3489
S2 – 1.3428
S3 – 1.3367
R1 – 1.3550
R2 – 1.3611
R3 – 1.3672
The GBP/USD pair maintains an uptrend. Trump's policies will continue to pressure the U.S. economy, so we do not expect long-term dollar strength. 2026 has been positive for the dollar due to geopolitics, but every story ends. On the weekly timeframe, the pair remains flat between 1.3150 and 1.3780 within a four-year uptrend, allowing for the expectation of continued pound appreciation in the medium term. Consider long positions with targets of 1.3611 and 1.3672 when price is above the moving average. If the price is below the moving average line, consider trading the downside with targets at 1.3449 and 1.3428.


