Patrones actuales

Los patrones son modelos gráficos que se forman en el gráfico mediante el precio. Según uno de los postulados del análisis técnico, la historia (movimiento del precio) se repite. Esto quiere decir que los movimientos del precio a menudo son similares en las mismas situaciones que hacen posible pronosticar el futuro desarrollo de la situación con una alta probabilidad.
Los patrones relevantes de InstaTrade son un servicio fácil de utilizar que permiten que conozca los últimos cambios en el mercado y reaccione a las pistas del mercado a tiempo. En nuestro servicio, siempre encontrará los últimos y más importantes patrones en cualquier par y en cualquier marco de tiempo.
Bullish Symmetrical Triangle
was formed on 03.06 at 22:00:35 (UTC+0)
signal strength 2 of 5
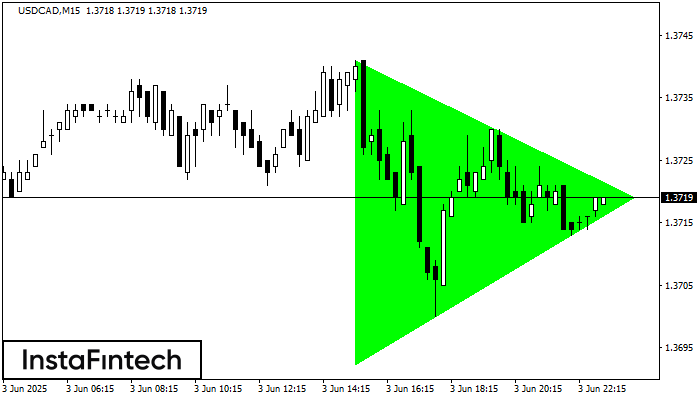
According to the chart of M15, USDCAD formed the Bullish Symmetrical Triangle pattern. Description: This is the pattern of a trend continuation. 1.3741 and 1.3692 are the coordinates of the upper and lower borders respectively. The pattern width is measured on the chart at 49 pips. Outlook: If the upper border 1.3741 is broken, the price is likely to continue its move by 1.3742.
The M5 and M15 time frames may have more false entry points.
Vea asimismo
- All
- All
- Bearish Rectangle
- Bearish Symmetrical Triangle
- Bearish Symmetrical Triangle
- Bullish Rectangle
- Double Top
- Double Top
- Triple Bottom
- Triple Bottom
- Triple Top
- Triple Top
- All
- All
- Buy
- Sale
- All
- 1
- 2
- 3
- 4
- 5
Rectángulo Bajista
was formed on 20.06 at 05:16:01 (UTC+0)
signal strength 2 of 5
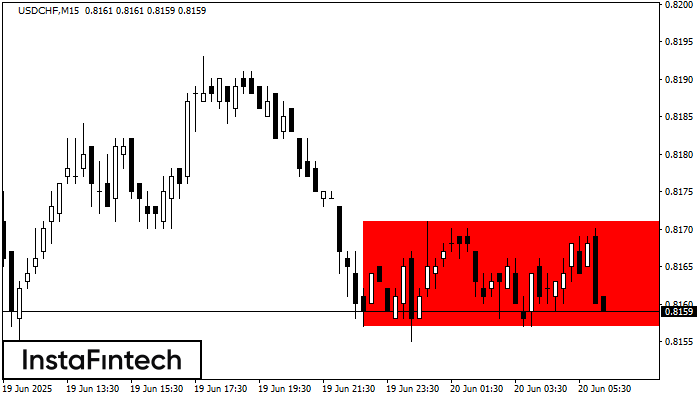
Según el gráfico de M15, USDCHF formó el Rectángulo Bajista. Este tipo de patrón indica la continuación de una tendencia. Esto consiste de dos niveles: resistencia 0.8171 - 0.0000
Los marcos de tiempo M5 y M15 pueden tener más puntos de entrada falsos.
Open chart in a new window
Doble Piso
was formed on 20.06 at 04:29:57 (UTC+0)
signal strength 3 of 5
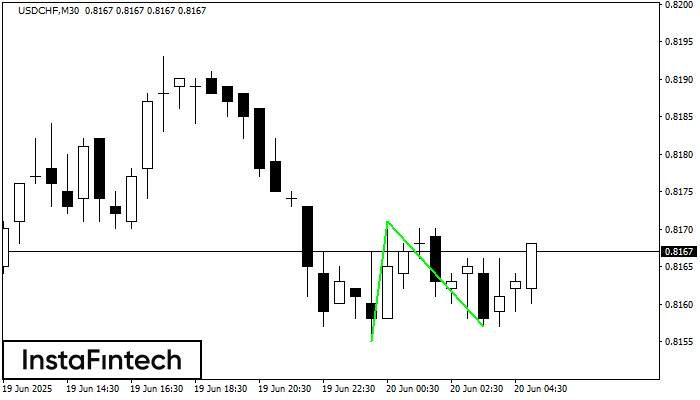
El patrón Doble Piso ha sido formado en USDCHF M30. Esta formación señala una reversión de la tendencia de bajista a alcista. La señal es que se debe abrir
Open chart in a new window
Banderín alcista
was formed on 20.06 at 02:45:38 (UTC+0)
signal strength 4 of 5
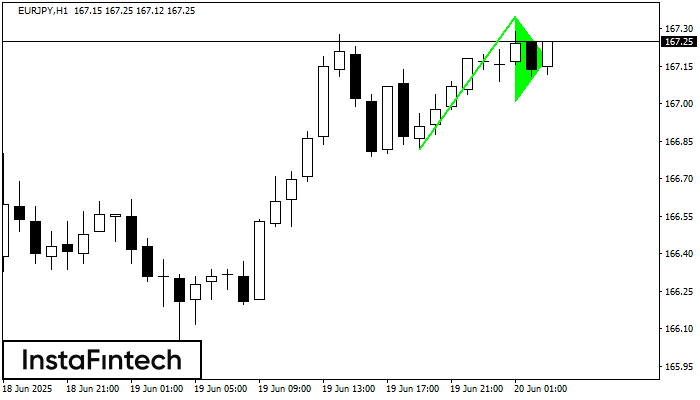
El patrón gráfico Banderín alcista se ha formado en el instrumento EURJPY H1. Este tipo de patrón entra en la categoría de patrones de continuación. En este caso
Open chart in a new window