Patrones actuales

Los patrones son modelos gráficos que se forman en el gráfico mediante el precio. Según uno de los postulados del análisis técnico, la historia (movimiento del precio) se repite. Esto quiere decir que los movimientos del precio a menudo son similares en las mismas situaciones que hacen posible pronosticar el futuro desarrollo de la situación con una alta probabilidad.
Los patrones relevantes de InstaTrade son un servicio fácil de utilizar que permiten que conozca los últimos cambios en el mercado y reaccione a las pistas del mercado a tiempo. En nuestro servicio, siempre encontrará los últimos y más importantes patrones en cualquier par y en cualquier marco de tiempo.
Bullish Symmetrical Triangle
was formed on 04.06 at 06:03:01 (UTC+0)
signal strength 3 of 5
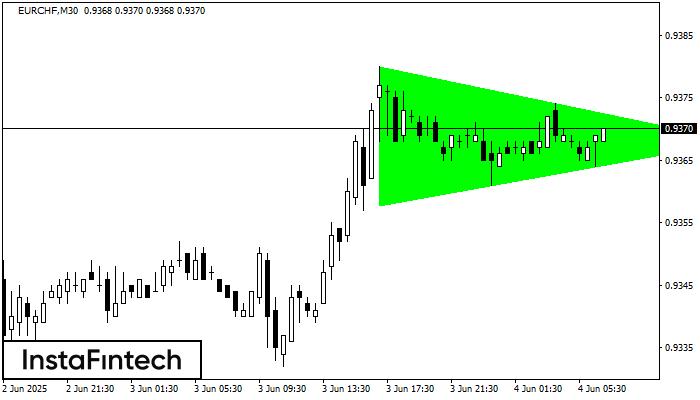
According to the chart of M30, EURCHF formed the Bullish Symmetrical Triangle pattern. Description: This is the pattern of a trend continuation. 0.9380 and 0.9358 are the coordinates of the upper and lower borders respectively. The pattern width is measured on the chart at 22 pips. Outlook: If the upper border 0.9380 is broken, the price is likely to continue its move by 0.9398.
Vea asimismo
- All
- All
- Bearish Rectangle
- Bearish Symmetrical Triangle
- Bearish Symmetrical Triangle
- Bullish Rectangle
- Double Top
- Double Top
- Triple Bottom
- Triple Bottom
- Triple Top
- Triple Top
- All
- All
- Buy
- Sale
- All
- 1
- 2
- 3
- 4
- 5
Bandera bajista
was formed on 19.06 at 20:10:43 (UTC+0)
signal strength 1 of 5
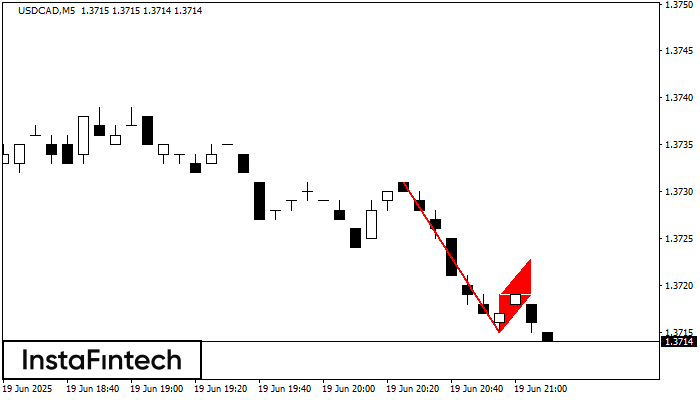
El patrón Bandera bajista ha sido formado en USDCAD a M5. El límite inferior del patrón está ubicado en 1.3715/1.3719 mientras el límite superior se encuentra en 1.3719/1.3723. La proyección
Los marcos de tiempo M5 y M15 pueden tener más puntos de entrada falsos.
Open chart in a new window
Banderín bajista
was formed on 19.06 at 20:10:37 (UTC+0)
signal strength 1 of 5
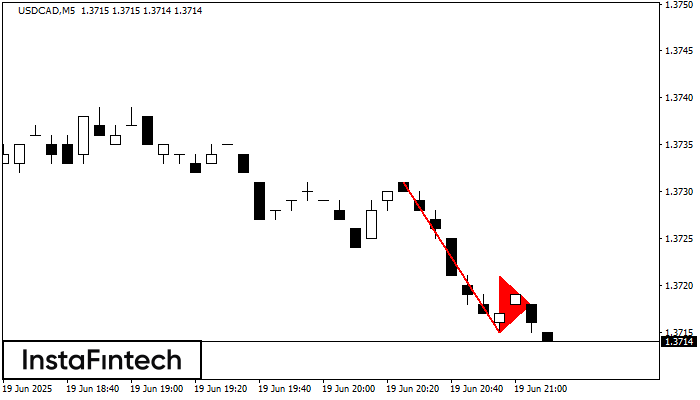
El patrón Banderín bajista se ha formado en el gráfico USDCAD M5. Esto señala la continuación potencial de la tendencia existente. Especificaciones: el piso del patrón tiene la coordinada
Los marcos de tiempo M5 y M15 pueden tener más puntos de entrada falsos.
Open chart in a new window
Triple Techo
was formed on 19.06 at 20:00:33 (UTC+0)
signal strength 2 of 5
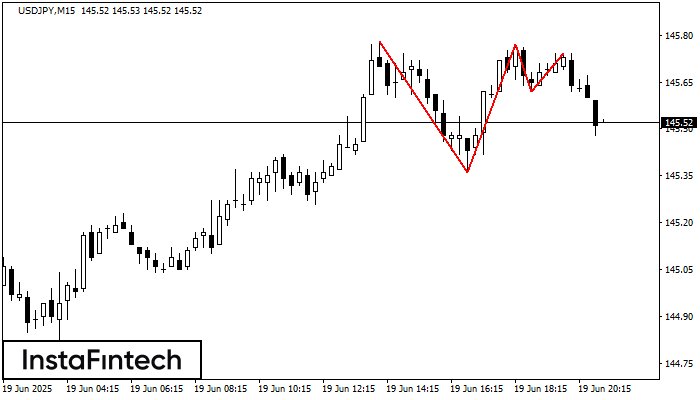
En el gráfico del instrumento de negociación USDJPY M15, se ha formado el patrón Triple Techo que señala un cambio en la tendencia. Es posible que después de la formación
Los marcos de tiempo M5 y M15 pueden tener más puntos de entrada falsos.
Open chart in a new window