Dolzarb patternlar

Прямоугольник
сформирован 20.06 в 10:10:53 (UTC+0)
сила сигнала 1 из 5
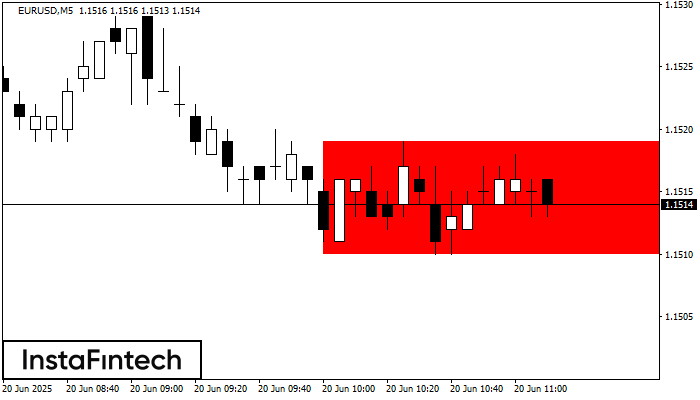
Сформирована фигура «Прямоугольник» на графике EURUSD M5. Тип фигуры: Продолжение тренда; Границы: Верхняя 1.1519, Нижняя 1.1510; Сигнал: позиция на продажу открывается после фиксации цены ниже границы прямоугольника 1.1510.
Таймфреймы М5 и М15 могут иметь больше ложных точек входа.
- Все
- Все
- Bearish Rectangle
- Bearish Symmetrical Triangle
- Bearish Symmetrical Triangle
- Bullish Rectangle
- Double Top
- Double Top
- Triple Bottom
- Triple Bottom
- Triple Top
- Triple Top
- Все
- Все
- Покупка
- Продажа
- Все
- 1
- 2
- 3
- 4
- 5
Bearish Rectangle
сформирован 28.07 в 03:52:46 (UTC+0)
сила сигнала 2 из 5

According to the chart of M15, NZDCHF formed the Bearish Rectangle. This type of a pattern indicates a trend continuation. It consists of two levels: resistance 0.4790 - 0.0000
The M5 and M15 time frames may have more false entry points.
Открыть график инструмента в новом окне
Bearish Rectangle
сформирован 28.07 в 03:51:32 (UTC+0)
сила сигнала 3 из 5
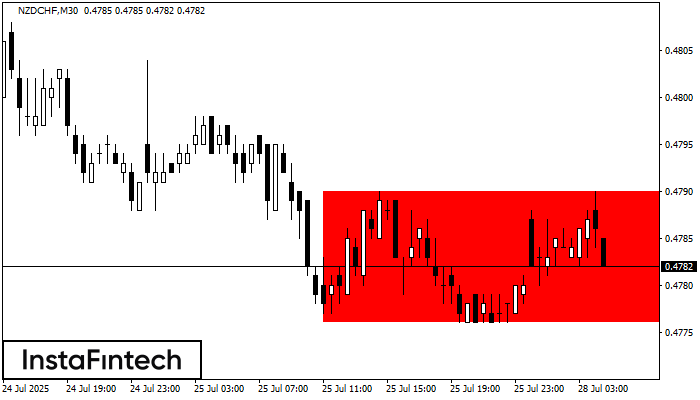
According to the chart of M30, NZDCHF formed the Bearish Rectangle which is a pattern of a trend continuation. The pattern is contained within the following borders: lower border 0.4776
Открыть график инструмента в новом окне
Double Top
сформирован 28.07 в 03:30:20 (UTC+0)
сила сигнала 2 из 5
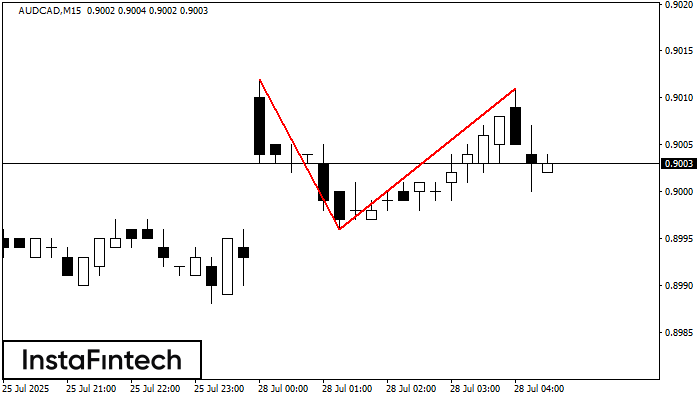
The Double Top pattern has been formed on AUDCAD M15. It signals that the trend has been changed from upwards to downwards. Probably, if the base of the pattern 0.8996
The M5 and M15 time frames may have more false entry points.
Открыть график инструмента в новом окне