আরও দেখুন

 25.08.2025 03:58 AM
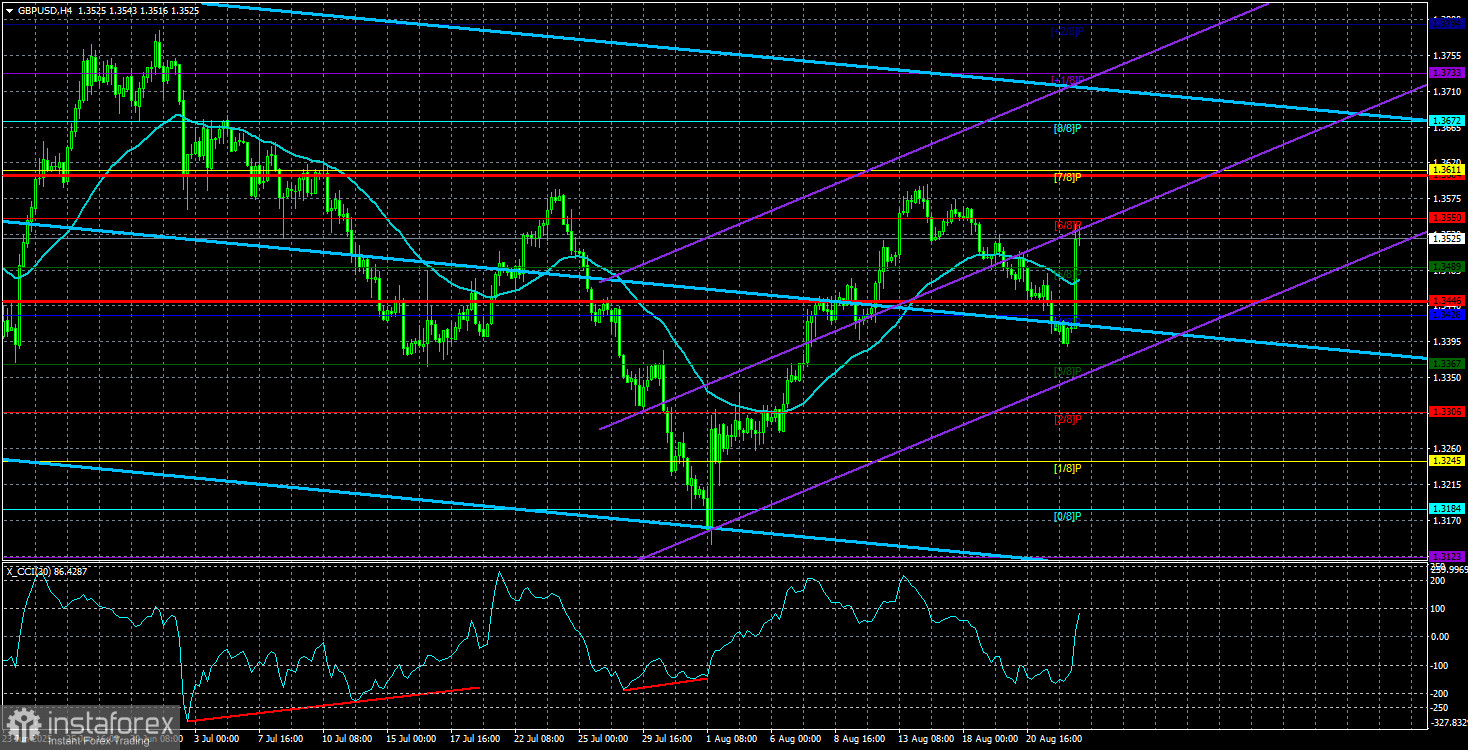
The GBP/USD pair shot sharply upward on Friday after a week-long downward correction. Throughout the week, we repeatedly emphasized that this was a technical correction. Before it began, the pair had been rising for two weeks, and the broader trend remains bullish. Thus, the price was simply correcting. One of the correction signals came from the UK inflation report, which exceeded forecasts. Since UK inflation has been rising for almost a year, this significantly reduces the likelihood of another Bank of England rate cut, especially after it has already lowered rates three times this year. With the British central bank highly unlikely to continue its easing cycle, while the Federal Reserve is expected to resume easing in the fall and accelerate it in 2026, the conclusion is obvious: the dollar has virtually no chance of medium-term growth. However, the market barely reacted to the UK inflation report last week, reinforcing our conviction that the downward move was purely technical.
On Friday, Jerome Powell delivered a speech in which we found absolutely nothing extraordinary. For the first time in a long while, he spoke of a possible rate cut, but he also listed the conditions required for such a move. In particular, the Fed intends to wait for upcoming inflation and labor market data before making new decisions. The Fed continues to prioritize price stability and does not view the three-month decline in the labor market as disastrous. In our view, Powell maintained a hawkish tone and merely admitted that a rate cut could be possible under certain circumstances. What about that is dovish or bearish for the dollar?
At the same time, the market fully understands that one way or another, the Fed rate will be reduced in the coming years. Either the Monetary Committee will be forced to cut rates due to problems in the U.S. labor market, or Donald Trump will pressure the Fed to do so. Thus, the dollar still has minimal potential for growth in principle. It cannot fall endlessly—technical corrections are an integral part of any trend.
In the UK, no significant events or reports are scheduled this week. Therefore, the focus shifts to the U.S. calendar. In the U.S., notable releases include the durable goods orders report, the second estimate of Q2 GDP, personal income and spending data, and the University of Michigan Consumer Sentiment Index. With some stretch, only the durable goods report can be considered important. The GDP release will be the second estimate, from which the market is unlikely to draw conclusions. Consumer spending and income data, as well as the sentiment index, are secondary indicators. Local reactions to these releases are possible, but they will not affect overall market sentiment or the broader pricing factors in 2025.
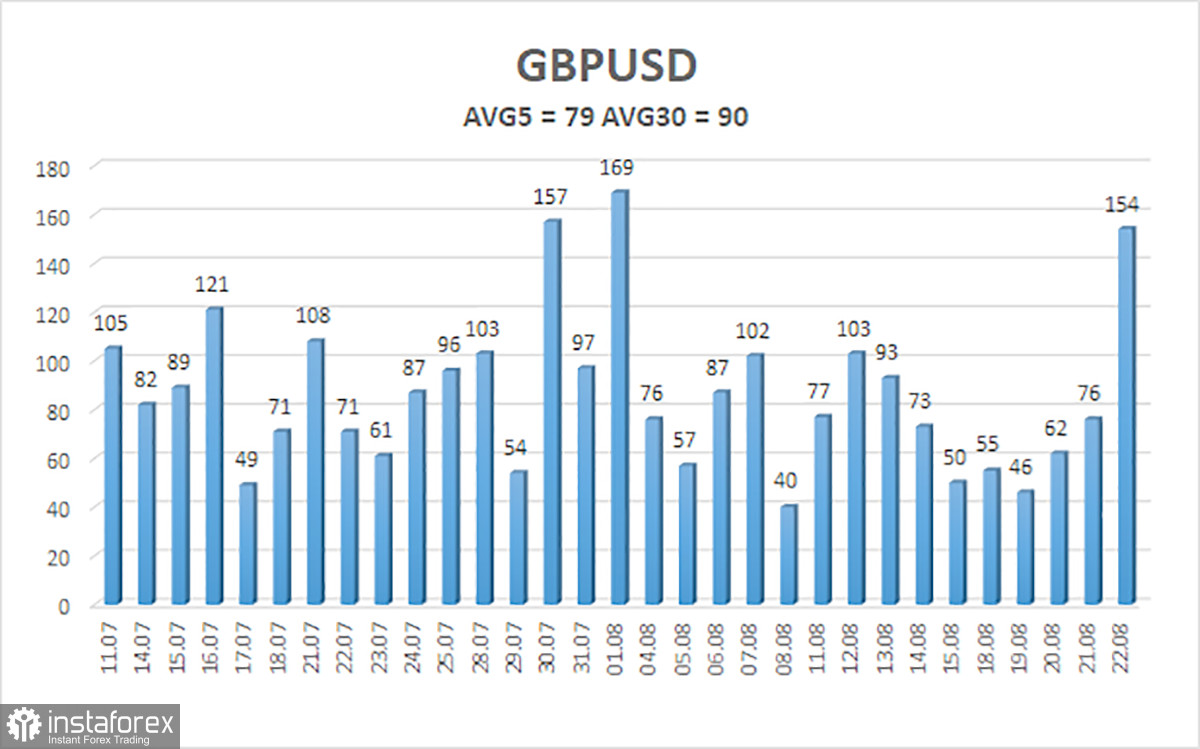
The average volatility of GBP/USD over the last five trading days is 79 pips, which is considered "average" for the pair. On Monday, August 25, we therefore expect movement within a range limited by 1,3446 and 1,3604. The long-term linear regression channel points upward, indicating a clear bullish trend. The CCI indicator twice entered the oversold zone, warning of a resumption of the upward trend. Several bullish divergences were also formed before the start of the new upward leg.
S1 – 1.3489
S2 – 1.3428
S3 – 1.3367
R1 – 1.3550
R2 – 1.3611
R3 – 1.3672
The GBP/USD pair has completed another round of downward correction. In the medium term, Donald Trump's policies are likely to continue pressuring the dollar. Thus, long positions targeting 1.3611 and 1.3672 remain more relevant as long as the price is above the moving average. A move below the moving average allows consideration of small shorts targeting 1.3367 on purely technical grounds. From time to time, the U.S. currency shows corrections, but for a trend-based strengthening, real signs of the end of the global trade war are required.
Linear Regression Channels help determine the current trend. If both channels are aligned, it indicates a strong trend.
Moving Average Line (settings: 20,0, smoothed) defines the short-term trend and guides the trading direction.
Murray Levels act as target levels for movements and corrections.
Volatility Levels (red lines) represent the likely price range for the pair over the next 24 hours based on current volatility readings.
CCI Indicator: If it enters the oversold region (below -250) or overbought region (above +250), it signals an impending trend reversal in the opposite direction.


