
আরও দেখুন


 01.09.2026 05:53 AM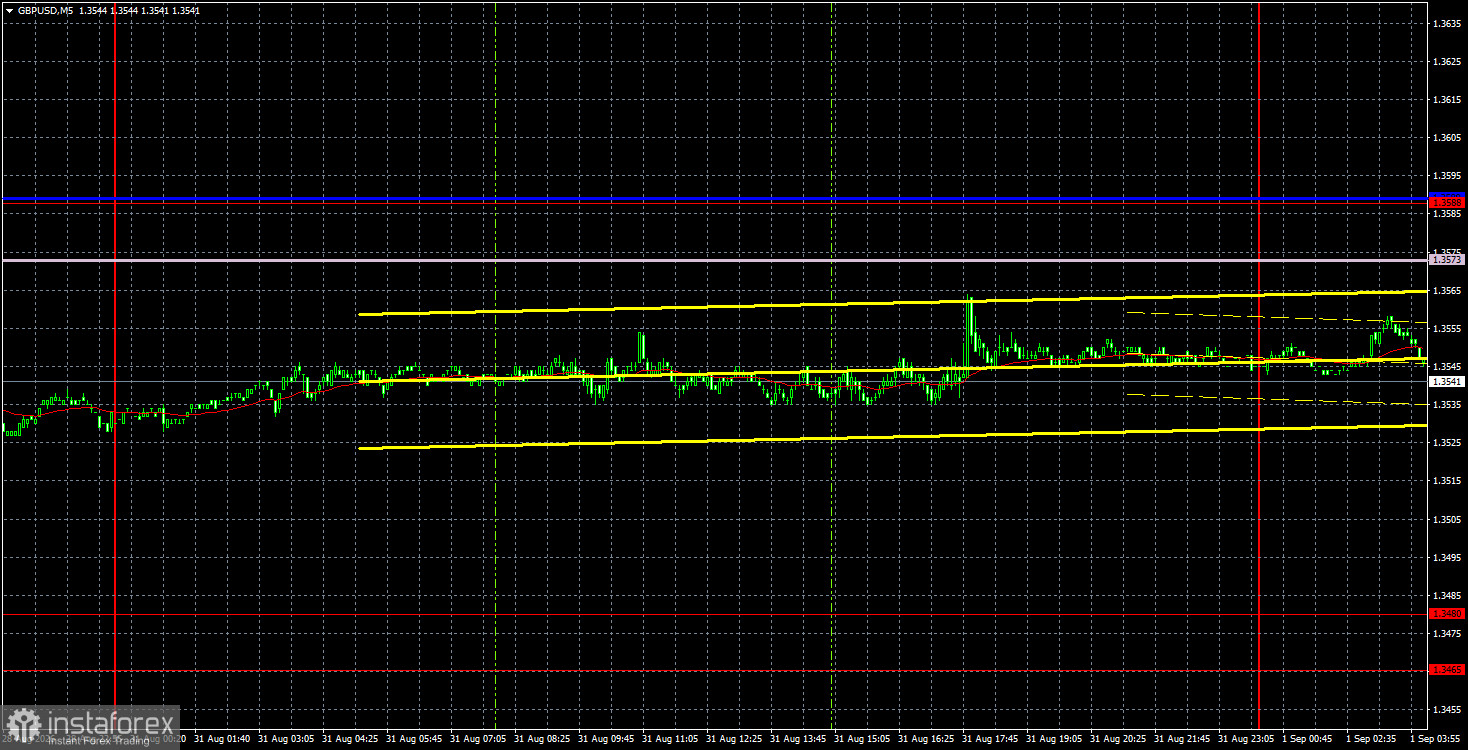
The GBP/USD currency pair traded very weakly on Monday, almost reluctantly. There is a reasonable explanation for this, given the complete absence of important news, events, and macroeconomic publications. As a result, traders had nothing to react to throughout the day, which explains their passivity. The British pound managed only a slight correction against the new downward trend, but the pair's decline can resume at any moment. Both the euro and the pound are looking downward this week. However, for the dollar to rise, it will require support from macroeconomic data. Today, the U.S. will release the JOLTS and ISM reports, which are considered relatively important.
Tension over Federal Reserve monetary policy eased last Friday amid Kevin Warsh's hawkish speech and the annual Nonfarm Payrolls report. However, we would like to note that there are no reasons to be joyful about the dollar. Nonfarm Payrolls turned out negative again, and Warsh has been promising to "work on inflation" for three months now. Yet the Fed has still not raised the key interest rate.
From a technical standpoint, the British pound has begun to form a downward trend, but much will depend this week on American labor market data, unemployment, and business activity. Thus, a decline in the pair can be expected, but one should not forget that the American economy and labor market have shown rather negative values in recent months.
On the 5-minute timeframe, no trading signals were formed on Monday. Throughout the day, the price moved only sideways with minimal volatility. Consequently, there were no grounds for traders to open positions.
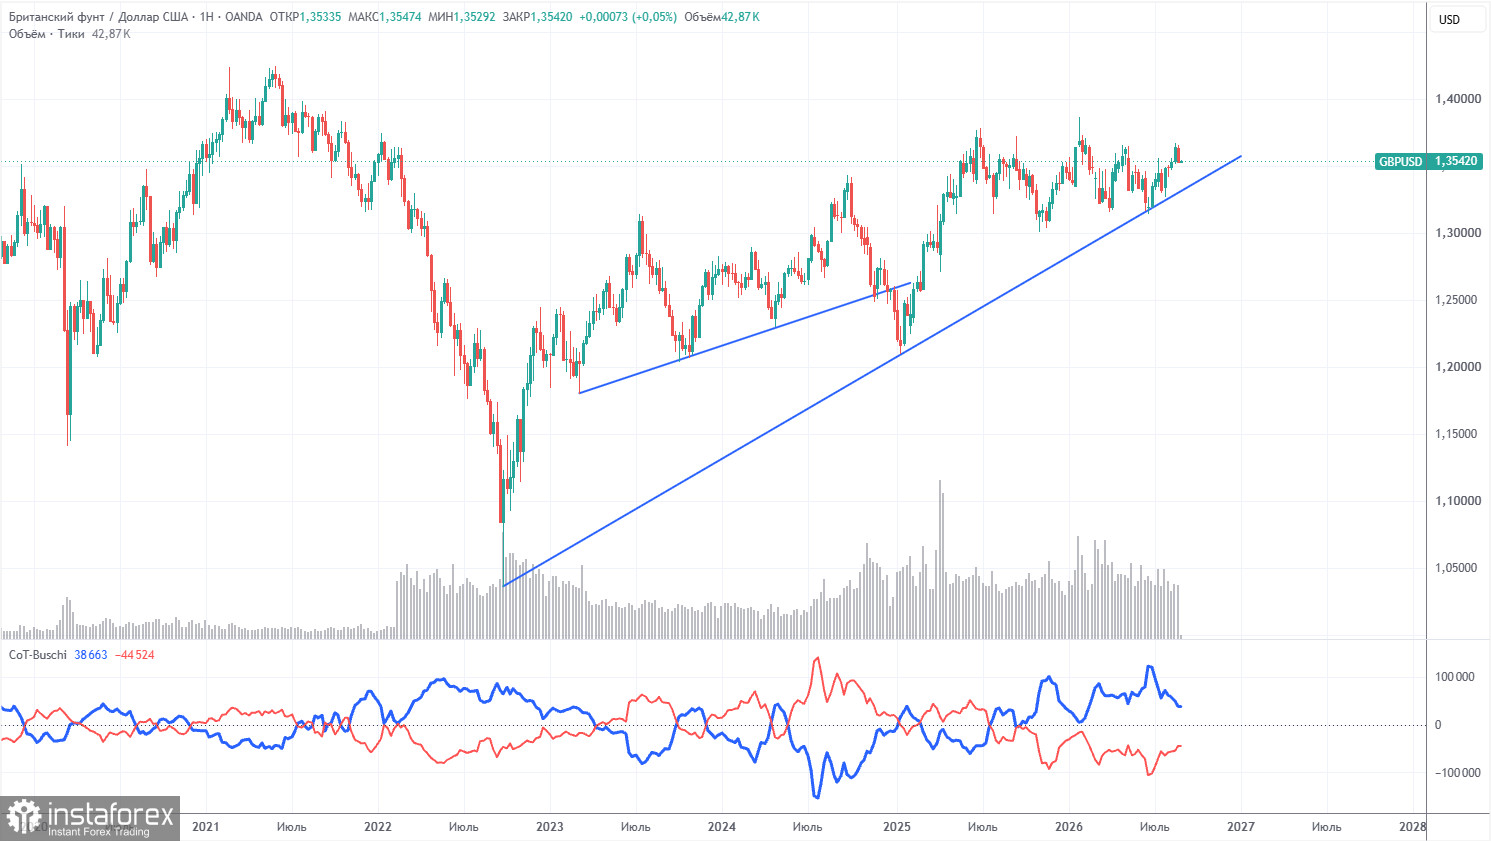
COT reports for the British pound indicate that for several consecutive months, non-commercial traders have dominated the market with selling positions. The net position is negative, despite the long-term upward trend being maintained. Given the events in the Middle East, it is not surprising that demand for the dollar was quite high in the first half of 2026. The war is formally over, but the conflict persists. Only geopolitics can support the U.S. dollar in the near term. However, until there is a consolidation below the trend line, we would not expect a significant decline in the pair.
In the long term, the dollar is expected to continue to weaken due to Donald Trump's policies, as is clearly visible on the weekly timeframe. The trade war will persist in one form or another for a long time, and Trump's policies are aimed both directly and indirectly at weakening the American currency. The long-term upward trend remains valid, as indicated by the trend line. The price has recently tested this line and bounced off it. According to the latest COT report (dated August 25), the "Non-commercial" group opened 16,300 BUY contracts and 6,200 SELL contracts. Thus, the net position of non-commercial traders increased by 10,100 contracts during the week.
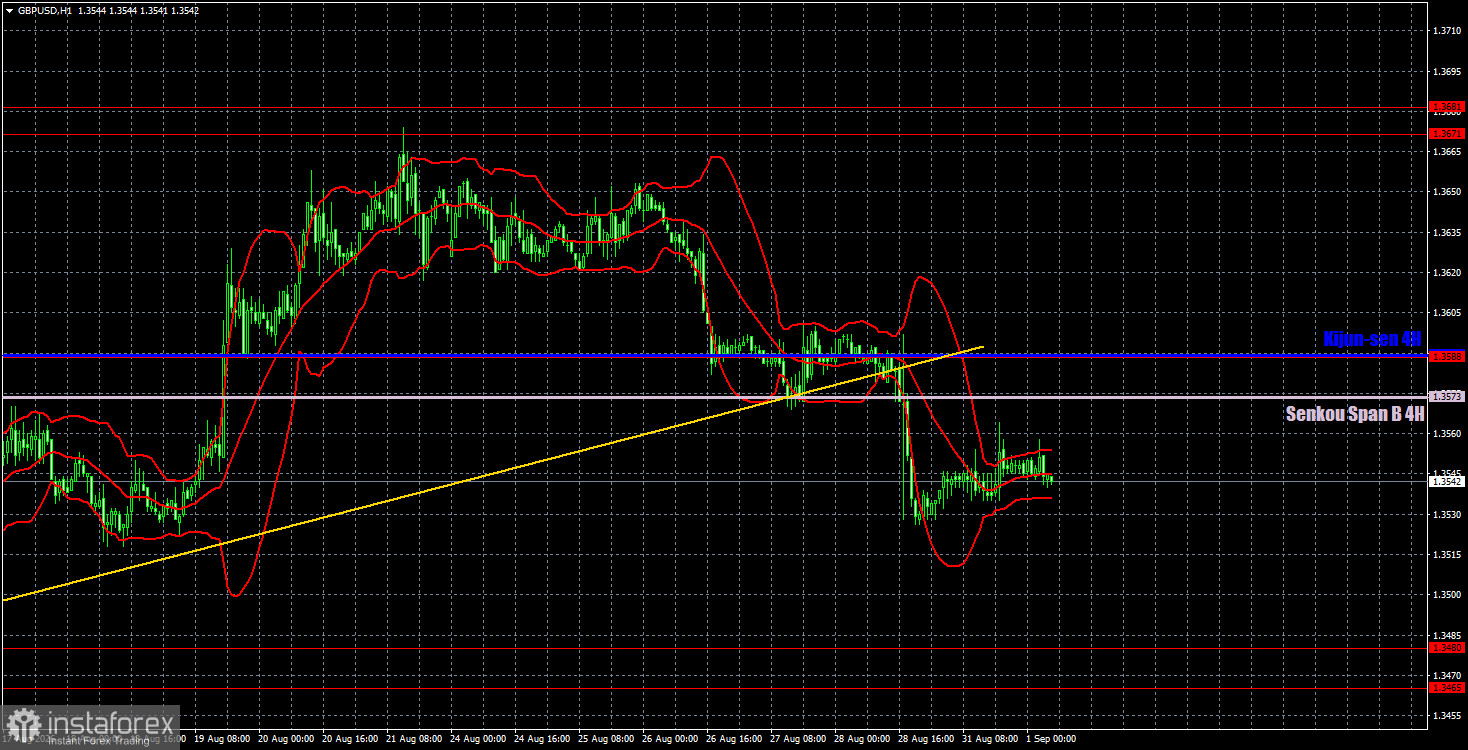
On the hourly timeframe, the GBP/USD pair has begun forming a new downward trend. However, in the long term, the British pound continues to look upward. We still do not see serious reasons for sustained, robust growth in the American currency, and this week, important reports from across the ocean may create numerous problems for bears. Nonetheless, technically, a decline this week will be quite logical.
For September 1, we highlight the following important levels: 1.3042-1.3050, 1.3096-1.3115, 1.3179-1.3187, 1.3301-1.3309, 1.3369-1.3377, 1.3465-1.3480, 1.3588, 1.3671-1.3681. The Senkou Span B line (1.3573) and Kijun-sen (1.3589) may also serve as sources of signals. It is recommended to set the stop-loss to break even after the price moves 20 pips in the right direction. The lines of the Ichimoku indicator may move throughout the day, which should be considered when determining trading signals.
On Tuesday, there are no significant events or publications scheduled in the UK. Still, the U.S. will release important reports on business activity in the manufacturing sector (ISM) and job openings (JOLTS). We believe that a market reaction may follow these data releases. The greater the deviation from forecasted values, the stronger the market reaction may be.
Today, traders may consider remaining in short positions targeting 1.3465-1.3480, as two sell signals formed in the area of 1.3574-1.3588 back on Friday, and the trend has shifted downward. Long positions can be opened today if the price consolidates above the 1.3573-1.3589 area, targeting 1.3671-1.3681.
Price levels (areas) of support and resistance are thick red lines where movement may conclude. They are not sources of trading signals.
The Kijun-sen and Senkou Span B lines are Ichimoku indicator lines transferred to the hourly timeframe from the 4-hour timeframe. They are strong lines.
Extreme levels are thin red lines from which the price has previously rebounded. They are sources of trading signals.
Yellow lines indicate trend lines, trending channels, and any other technical patterns.
Indicator 1 on COT charts shows the size of the net position of each category of traders.


