
 20.06.2025 07:16 AM
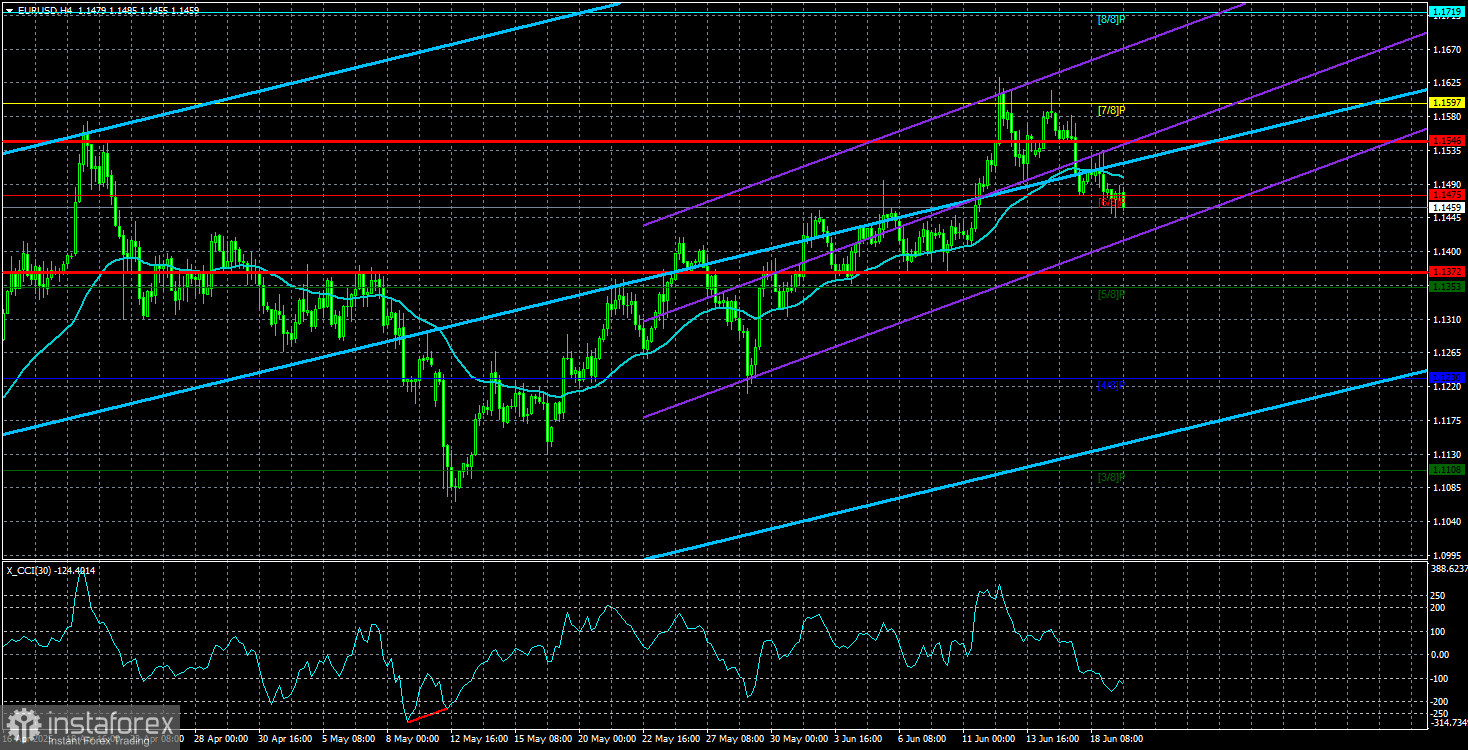
The EUR/USD currency pair traded relatively calmly on Wednesday and Thursday. Recall that the results of the latest 2025 Federal Reserve meeting were announced on Wednesday evening, but we didn't cover this event in yesterday's article. We firmly believe the market reaction to such major events can last up to 24 hours. Moreover, the price does not always move in one direction during this entire "reaction period." It's quite common for traders to react emotionally by selling, only to reverse the move after realizing their mistake. Therefore, we always emphasize that time is necessary for emotions to settle and for the market to fully absorb the information received.
This time, however, there wasn't much to digest. As expected, the key rate remained unchanged at 4.5%, and Jerome Powell made no strong or surprising statements. His rhetoric regarding economic growth, the labor market, inflation, and unemployment remained unchanged. The Fed Chair still believes that until Trump's import tariffs become permanent, it will not make sense to issue economic forecasts, let alone adjust monetary policy. The Fed is still uncertain about the final level of these tariffs, which determines their economic impact.
There is one thing Powell and the Fed are 100% certain of—tariffs will be imposed. Therefore, Powell anticipates rising inflation, economic slowdown, and labor market cooling. Inflation is already rising, and the economy is slowing down. So, the Fed's concerns are not unfounded. Thus, Powell maintains a completely justified stance and pays no mind to Donald Trump's constant demands to cut the key rate. The Fed didn't submit to Trump eight years ago, and it's not doing so now. Powell didn't give in to Trump back then and has no intention of doing so now.
The only notable change was a sharp decrease in the number of members supporting two rate cuts in 2025. The "dot plot" chart showed that seven Fed members now do not expect any easing this year, compared to four three months ago. It also showed that for 2026–2027, the monetary committee now expects a maximum of two rate cuts, whereas the previous dot plot signaled four. This clearly indicates a shift toward more hawkish expectations.
Nevertheless, the Fed has held a hawkish stance since the beginning of the year. Let's not forget that most traders expected four rate cuts this year, although Fed officials never suggested more than two. Half a year has passed with no easing measures taken, and now nearly half of the Committee believes there won't be any by year-end. Therefore, the dollar could have shown steady growth all this time, especially amid easing policies by the Bank of England and the European Central Bank. But... Trump. The dollar has strengthened over the last few days but hasn't gained any long-term prospects.
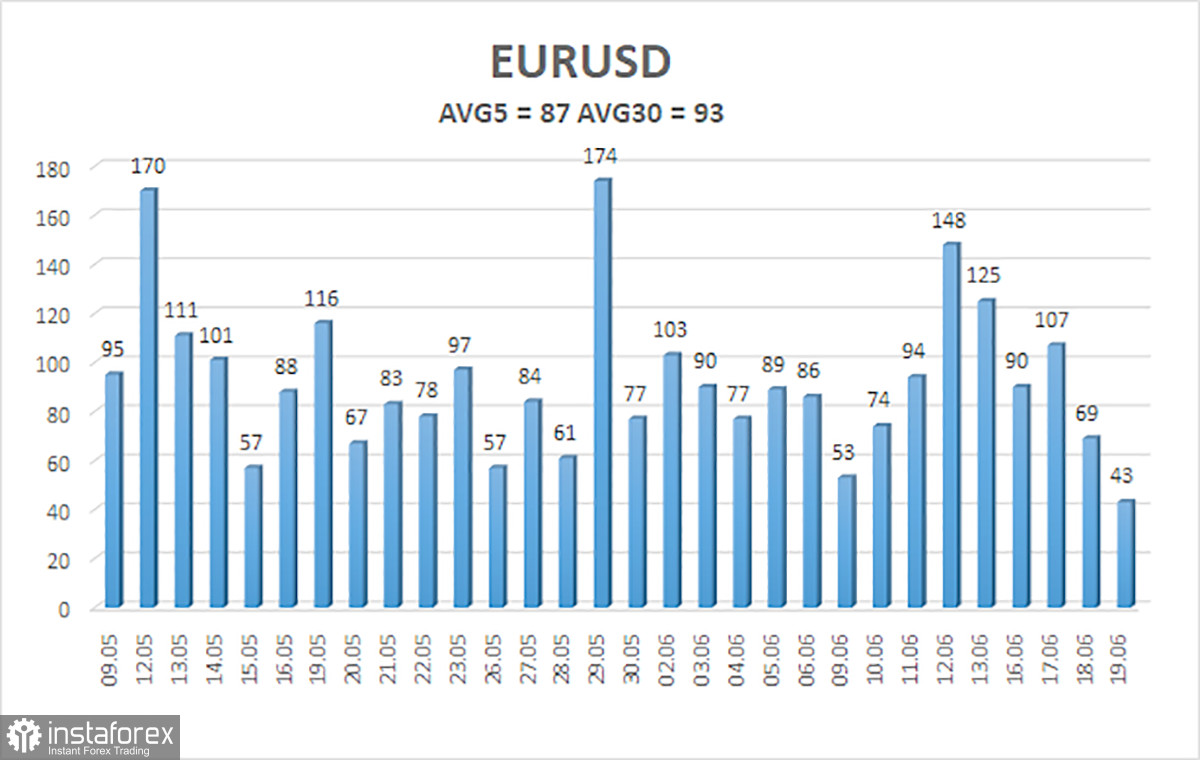
The average volatility of the EUR/USD pair over the last five trading days as of June 20 is 87 pips, which is considered "moderate." On Friday, we expect the pair to move between 1.1372 and 1.1546. The long-term regression channel points upward, indicating the continuation of the uptrend. The CCI indicator entered overbought territory again, triggering only a mild downward correction.
S1 – 1.1353
S2 – 1.1230
S3 – 1.1108
R1 – 1.1475
R2 – 1.1597
R3 – 1.1719
The EUR/USD pair continues its uptrend. Trump's foreign and domestic policies continue to exert strong pressure on the U.S. dollar. In addition, the market interprets or ignores much of the data unfavorably for the dollar. We note a complete reluctance on the market's part to buy the dollar under any circumstances. If the price is below the moving average, short positions remain valid with targets at 1.1372 and 1.1353, although a sharp decline in the pair under current conditions should not be expected. If the price is above the moving average, long positions can be considered with targets at 1.1546 and 1.1597 in continuation of the trend.
Linear Regression Channels help determine the current trend. If both channels are aligned, it indicates a strong trend.
Moving Average Line (settings: 20,0, smoothed) defines the short-term trend and guides the trading direction.
Murray Levels act as target levels for movements and corrections.
Volatility Levels (red lines) represent the likely price range for the pair over the next 24 hours based on current volatility readings.
CCI Indicator: If it enters the oversold region (below -250) or overbought region (above +250), it signals an impending trend reversal in the opposite direction.


