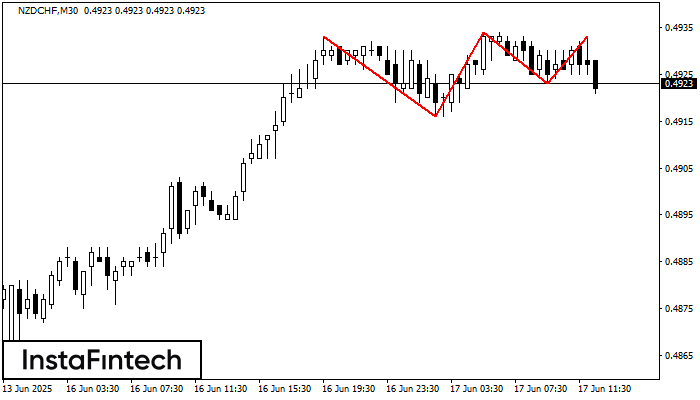
Triple Top
was formed on 17.06 at 12:00:36 (UTC+0)
signal strength 3 of 5

The Triple Top pattern has formed on the chart of the NZDCHF M30. Features of the pattern: borders have an ascending angle; the lower line of the pattern has the coordinates 0.4916/0.4923 with the upper limit 0.4933/0.4933; the projection of the width is 17 points. The formation of the Triple Top figure most likely indicates a change in the trend from upward to downward. This means that in the event of a breakdown of the support level of 0.4916, the price is most likely to continue the downward movement.
Figure
Instrument
Timeframe
Trend
Signal Strength


