Corak sebenar

Triple Top
was formed on 17.06 at 12:00:36 (UTC+0)
signal strength 3 of 5
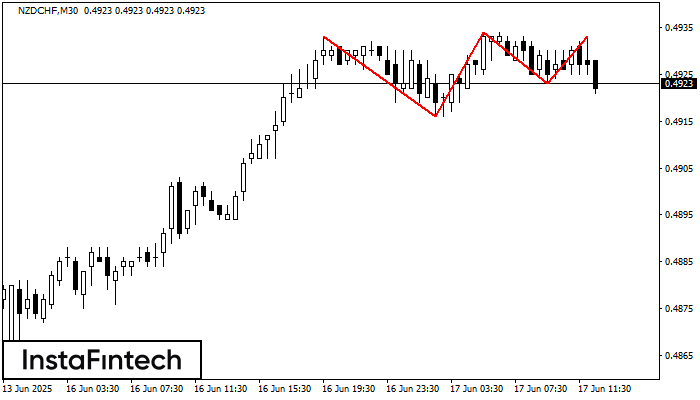
The Triple Top pattern has formed on the chart of the NZDCHF M30. Features of the pattern: borders have an ascending angle; the lower line of the pattern has the coordinates 0.4916/0.4923 with the upper limit 0.4933/0.4933; the projection of the width is 17 points. The formation of the Triple Top figure most likely indicates a change in the trend from upward to downward. This means that in the event of a breakdown of the support level of 0.4916, the price is most likely to continue the downward movement.
Juga lihat
- All
- All
- Bearish Rectangle
- Bearish Symmetrical Triangle
- Bearish Symmetrical Triangle
- Bullish Rectangle
- Double Top
- Double Top
- Triple Bottom
- Triple Bottom
- Triple Top
- Triple Top
- All
- All
- Buy
- Sale
- All
- 1
- 2
- 3
- 4
- 5
Segi Tiga Simetri Menaik
was formed on 21.06 at 15:17:59 (UTC+0)
signal strength 1 of 5
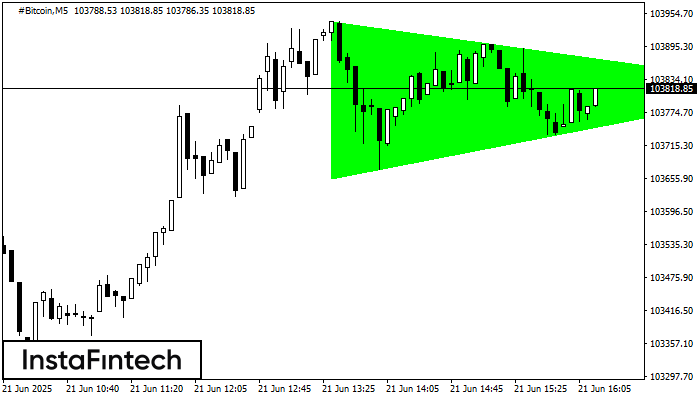
Berdasarkan carta M5, #Bitcoin membentuk corak Segi Tiga Simetri Menaik. Sempadan yang lebih rendah bagi corak yang menyentuh koordinat 103655.19/103820.77 di mana sempadan atas merentasi 103940.04/103820.77. Sekiranya corak Segi Tiga
Carta masa M5 dan M15 mungkin mempunyai lebih banyak titik kemasukan palsu.
Open chart in a new window
Triple Bottom
was formed on 20.06 at 22:20:23 (UTC+0)
signal strength 1 of 5

Corak Triple Bottom telah dibentuk pada GOLD M5. Ia mempunyai ciri-ciri berikut: tahap rintangan 3372.86/3370.25; tahap sokongan 3364.73/3364.26; lebar corak adalah 813 mata. Dalam situasi penembusan paras rintangan 3372.86, harga
Carta masa M5 dan M15 mungkin mempunyai lebih banyak titik kemasukan palsu.
Open chart in a new window
Segi Empat Menurun
was formed on 20.06 at 20:57:12 (UTC+0)
signal strength 2 of 5

Berdasarkan carta M15, #GOOG telah membentuk Segi Empat Menurun. Corak ini menunjukkan kesinambungan aliran. Sempadan atas adalah 170.41, sempadan bawah adalah 169.00. Isyarat bermakna bahawa kedudukan pendek perlu dibuka selepas
Carta masa M5 dan M15 mungkin mempunyai lebih banyak titik kemasukan palsu.
Open chart in a new window