See also

 05.05.2025 06:06 AM
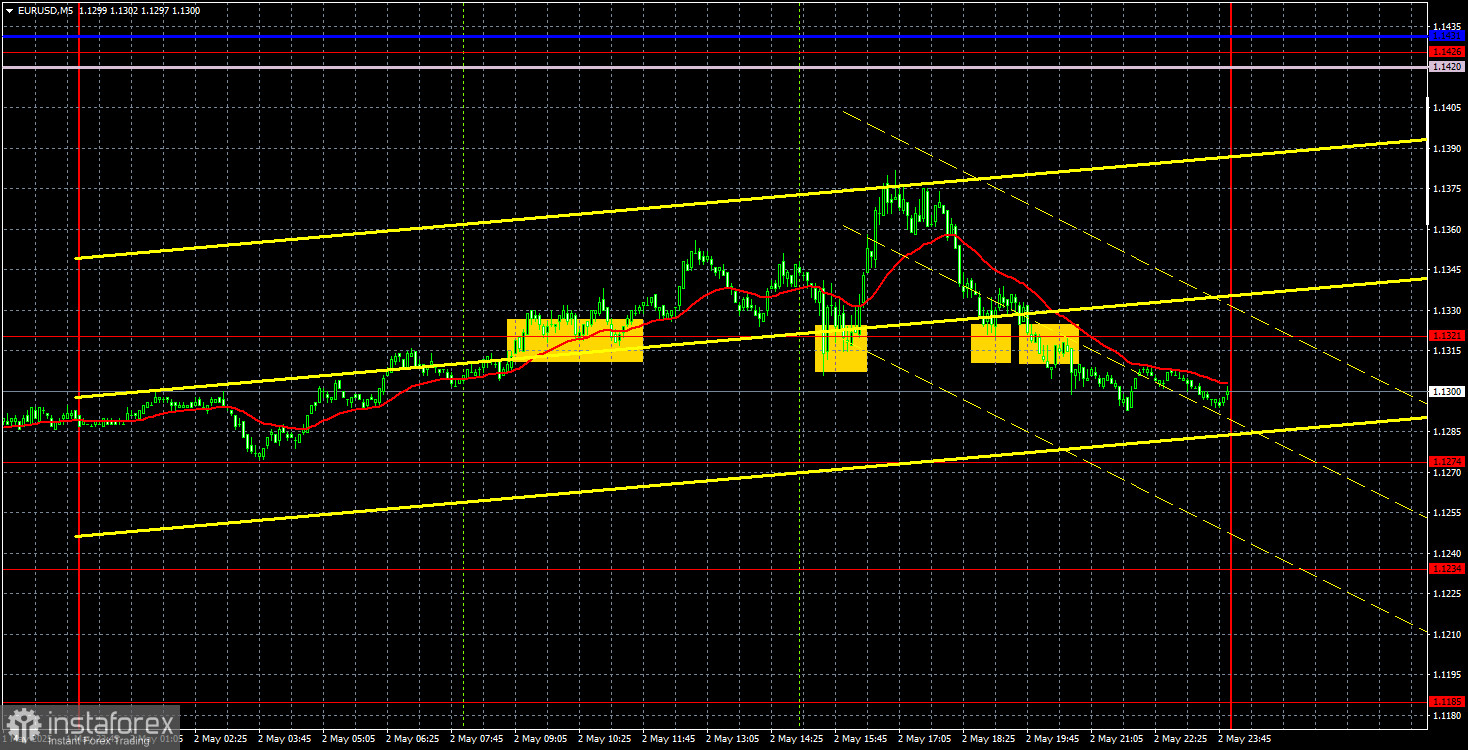
The EUR/USD currency pair generally continued its downward movement throughout Friday. The U.S. dollar has strengthened over the past week, but this growth seems to lack solid justification. On Monday, the U.S. currency unexpectedly dropped by nearly 100 pips without any visible reason. It gained back around 150 pips from Tuesday to Friday —even though almost all U.S. macroeconomic data released last week severely underperformed. Therefore, this recent upward move cannot be considered stable, confident, or fundamentally justified.
It's also worth noting that the flat trend in EUR/USD has persisted for over three weeks. The price has been moving between 1.1274 and 1.1426 throughout this period, and last week was no exception. Thus, all the dollar has achieved is a minor strengthening within a sideways channel that doesn't require any macroeconomic or fundamental catalysts. The dollar has no clear upside prospects as long as the price does not consolidate below the 1.1274 level. It could lose more in a single day than it gained over the previous week.
From a technical standpoint, the movement in the 5-minute timeframe leaves much to be desired. First, the flat trend continues—and flat always means choppy movement. Second, market moves are currently unresponsive to incoming news, a fact that was again confirmed last week. On Friday, several trading signals were generated near the 1.1321 level, but none reached the nearest target, reaffirming that this is not an ideal time for trading. A flat market is still a flat market.
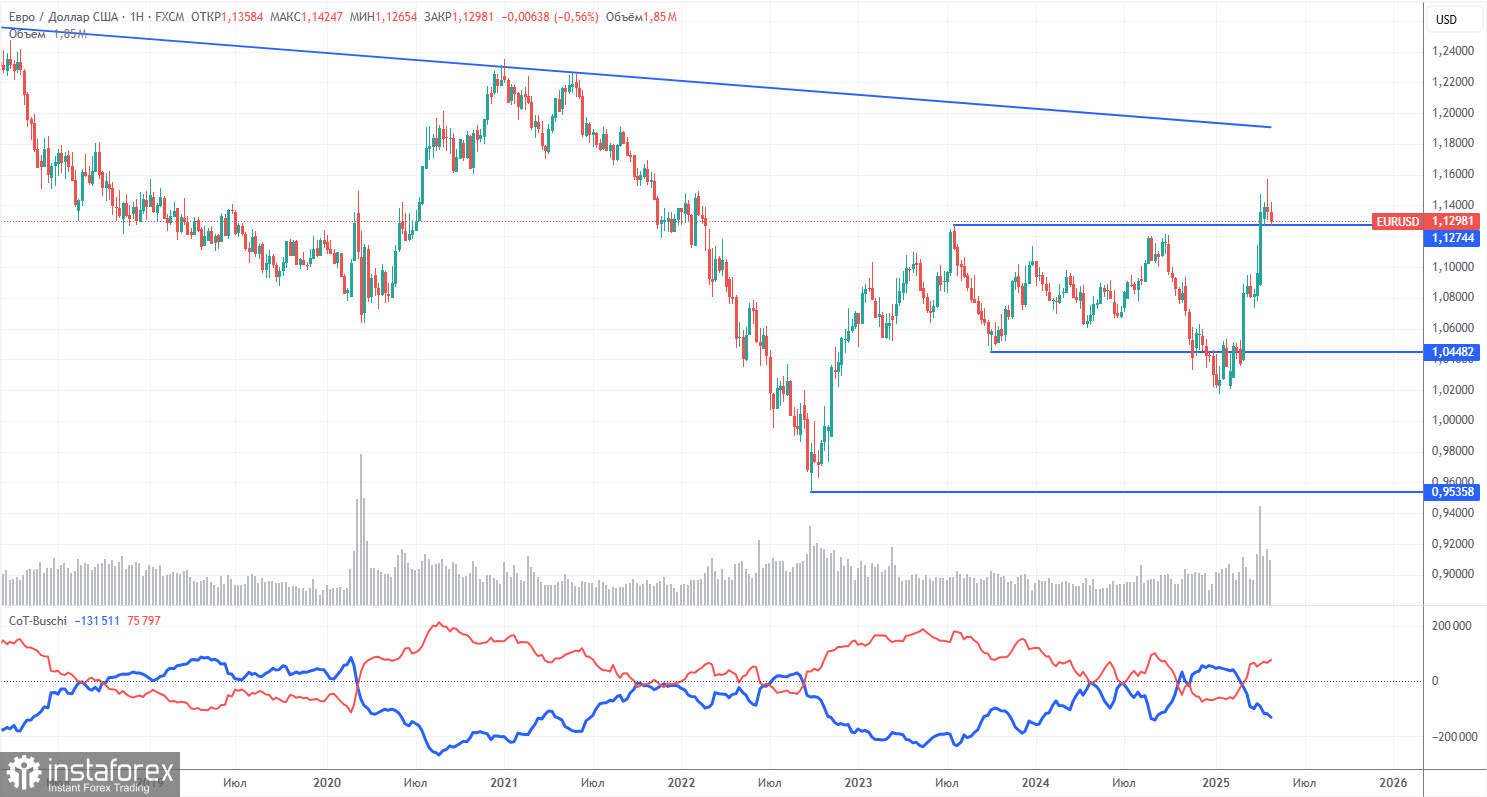
The latest Commitment of Traders (COT) report is dated April 29. The chart above clearly shows that the net position of non-commercial traders has remained bullish for a long time. Bears barely managed to gain the upper hand but quickly lost it. Since Donald Trump took office, the dollar has been on a steep decline. We cannot definitively say that this decline will continue indefinitely, and the COT reports reflect the sentiment of large players—which, under the current circumstances, can change very quickly.
Still, we continue to see no fundamental reasons for the euro to strengthen, while the dollar does have one significant reason to decline. The pair may continue to correct for a few more weeks or months, but the 16-year downtrend for the U.S. currency is unlikely to end so easily.
The red and blue lines have crossed again, signaling a bullish market trend. Over the last reporting week, long positions among non-commercial traders increased by 200, while short positions dropped by 10,600. As a result, the net position grew by 10,400 thousand contracts.
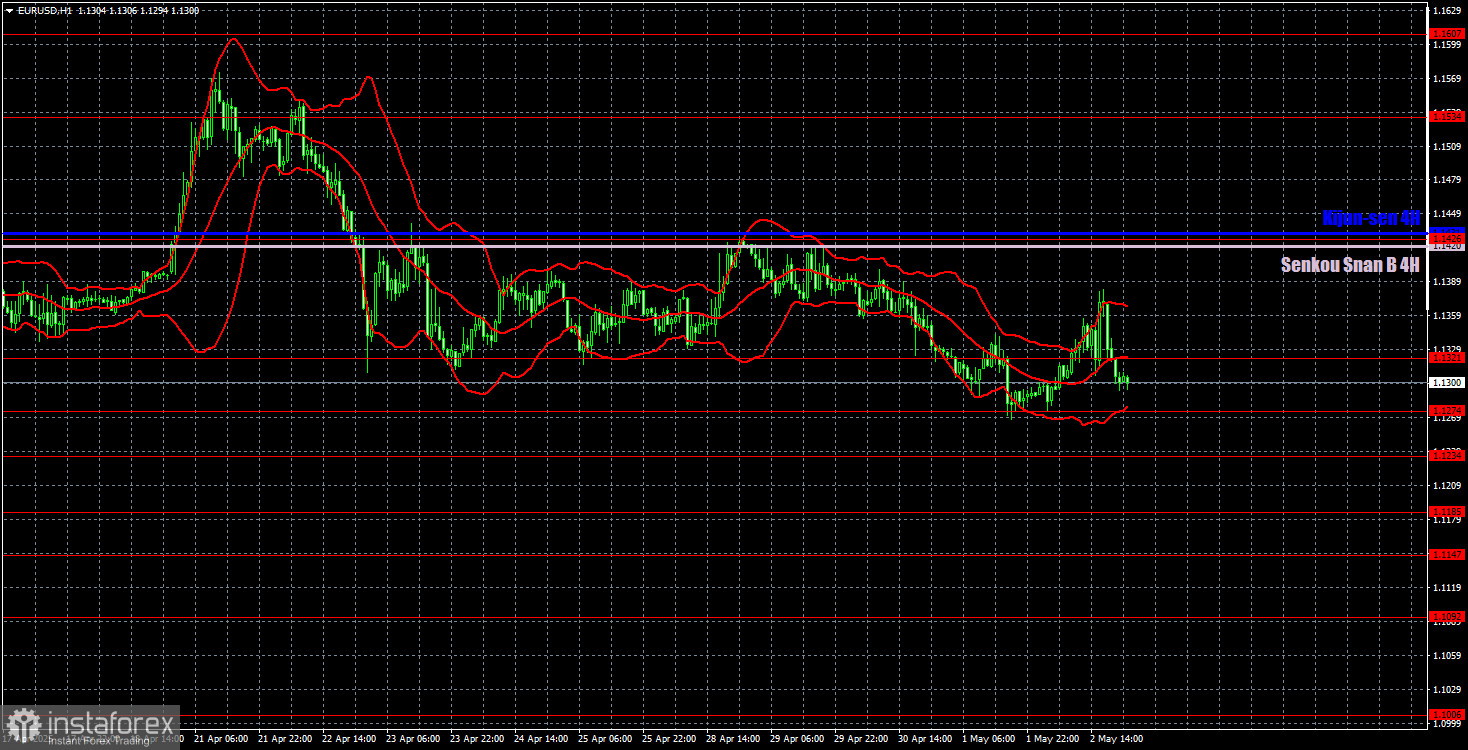
On the hourly timeframe, EUR/USD still maintains an upward bias, though it has been trading sideways recently due to the lack of news related to Trump's trade policy maneuvers. There is very little logic or technical clarity in price movements across any timeframe, and the macroeconomic background has no influence. The market continues to wait for clarity on the trade war front—either further escalation or de-escalation. Until then, it is not ready to commit to a directional trend.
The following levels are relevant for trading on May 5: 1.0823, 1.0886, 1.0949, 1.1006, 1.1092, 1.1147, 1.1185, 1.1234, 1.1274, 1.1321, 1.1426, 1.1534, 1.1607, 1.1666. Also, monitor the Ichimoku indicator's Senkou Span B (1.1420) and Kijun-sen (1.1431) lines. These lines may shift throughout the day and should be considered when identifying signals. Don't forget to place a Stop Loss at breakeven if the price moves 15 pips in your favor—this protects against potential losses from false signals.
No significant events or reports are scheduled for Monday in the Eurozone. In the U.S., only the ISM Services PMI will be released. While this is typically a significant indicator capable of provoking a strong market reaction, it's unlikely to have much impact this time. The market has ignored a large volume of macroeconomic and fundamental data over the past week—and even over the last two months. Traders continue to focus almost exclusively on "Trump-driven" trading.


