See also

 12.06.2025 10:15 AM
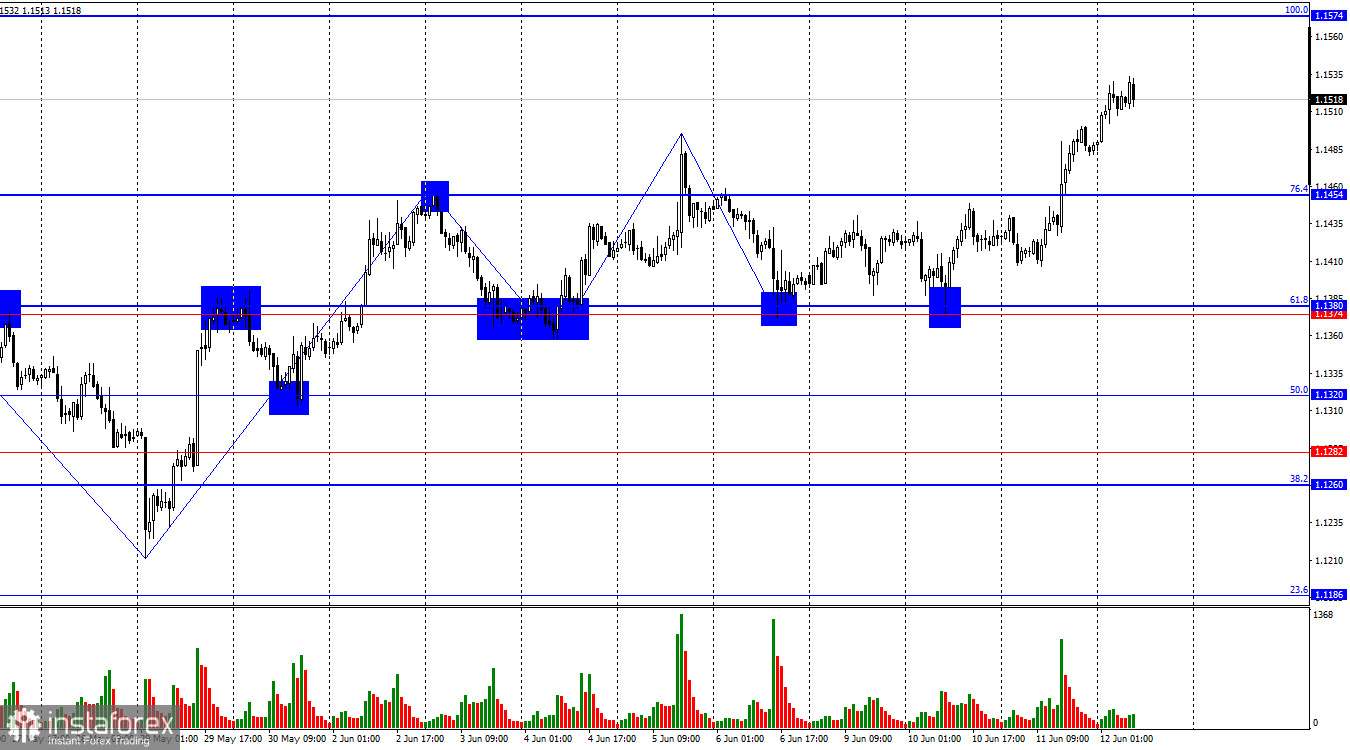
Good day, dear traders! On Wednesday, the EUR/USD pair continued its upward movement after rebounding from the support zone of 1.1374–1.1380. It successfully consolidated above the 76.4% Fibonacci retracement level at 1.1454, which gives traders grounds to expect further growth toward the next retracement level of 100.0% at 1.1574. A rebound from this level would favor the US dollar and a slight decline, while consolidation above it would increase the likelihood of continued growth.
Wave Situation on the Hourly Chart
The wave picture on the hourly chart remains clear. The last completed downward wave did not break the previous low, while the last upward wave surpassed the previous peak. Therefore, the trend currently remains bullish. The latest news about increased tariffs on steel and aluminum forced the bears to retreat again, and the lack of real progress in US-China negotiations discourages them from launching new attacks. A trend reversal to bearish would only be confirmed by consolidation below the 1.1374–1.1380 zone.
Macroeconomic Background
Wednesday's news backdrop was relatively light, but even a single US inflation report triggered a sharp reaction from bullish traders. In my opinion, there was nothing particularly alarming in the report that would warrant such a strong retreat by the bears. However, the market interpreted the report in its own way.
The Consumer Price Index rose from 2.3% YoY to 2.4% YoY. The Core CPI remained unchanged at 2.8% YoY. Traders were expecting slightly higher figures, and the absence of stronger inflation was seen as a signal that the Federal Reserve may soon resume monetary policy easing. If inflation is not increasing as Jerome Powell anticipated, and economic growth is slowing, then stimulus is needed, and such high rates may no longer be justified. Of course, inflation could still rise, especially if Trump hikes tariffs further. For this reason, I do not believe the Fed will cut rates at the next meeting. But the market thinks otherwise.
H4 Chart Overview
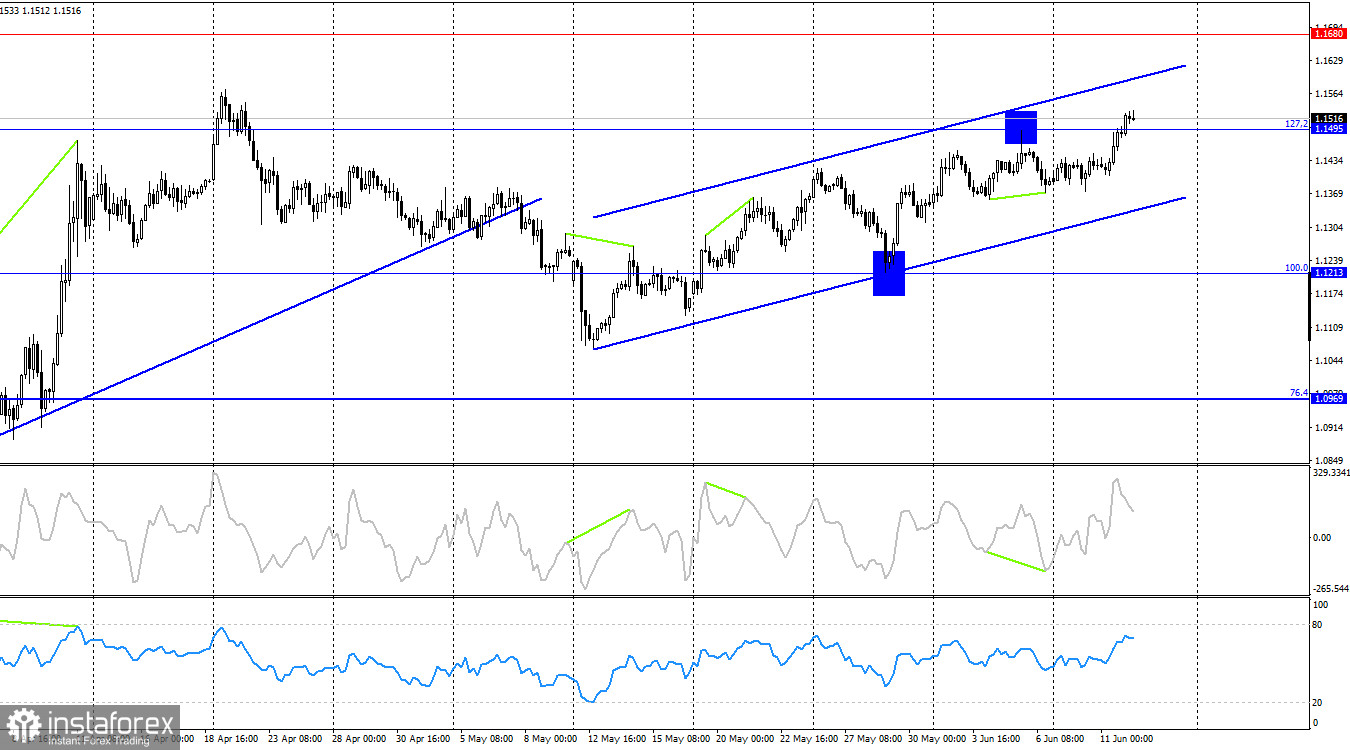
On the 4-hour chart, the pair climbed to the 127.2% Fibonacci retracement level at 1.1495 and consolidated above it. This opens the way for continued growth toward the next target at 1.1680. The upward channel points to a bullish trend. Only consolidation below 1.1495 would suggest a possible reversal in favor of the dollar and a move toward the channel's lower boundary. Currently, there are no forming divergences.
Commitments of Traders (COT) Report
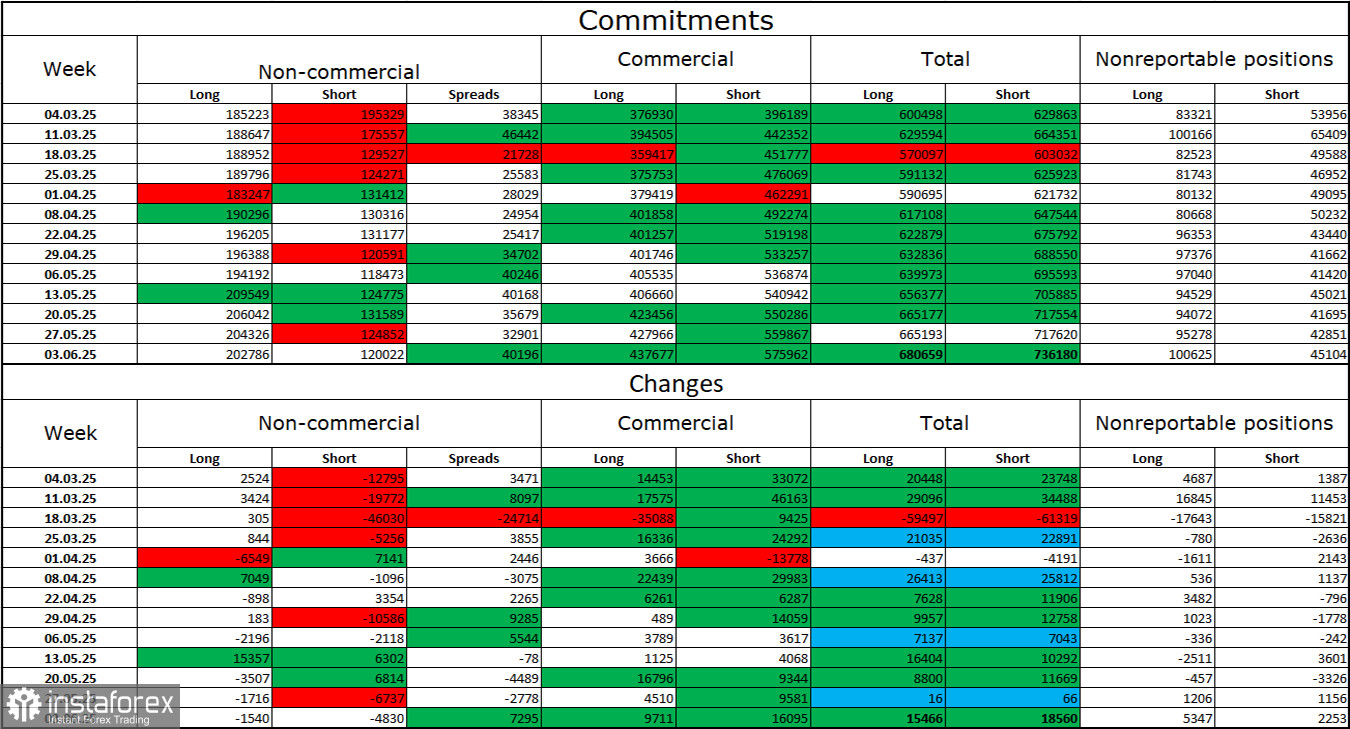
During the most recent reporting week, professional traders closed 1,540 long contracts and 4,830 short contracts. The sentiment among the "Non-commercial" group remains bullish, primarily due to Trump. The total number of long positions held by speculators now stands at 203,000, compared to 120,000 shorts, and the gap continues to widen. The euro remains in demand, while the dollar does not. The situation remains unchanged.
For 18 consecutive weeks, large players have been closing short positions and increasing long positions. Despite the significant divergence in monetary policy between the European Central Bank and the Fed, Trump's policies carry more weight for traders due to their potential to trigger a recession and other long-term structural problems in the US economy.
News Calendar for the US and Eurozone:
The economic calendar contains only two minor events on June 12, suggesting that market sentiment on Thursday is unlikely to be influenced by fundamentals.
Fibonacci Levels:


