See also

 13.06.2025 03:41 AM
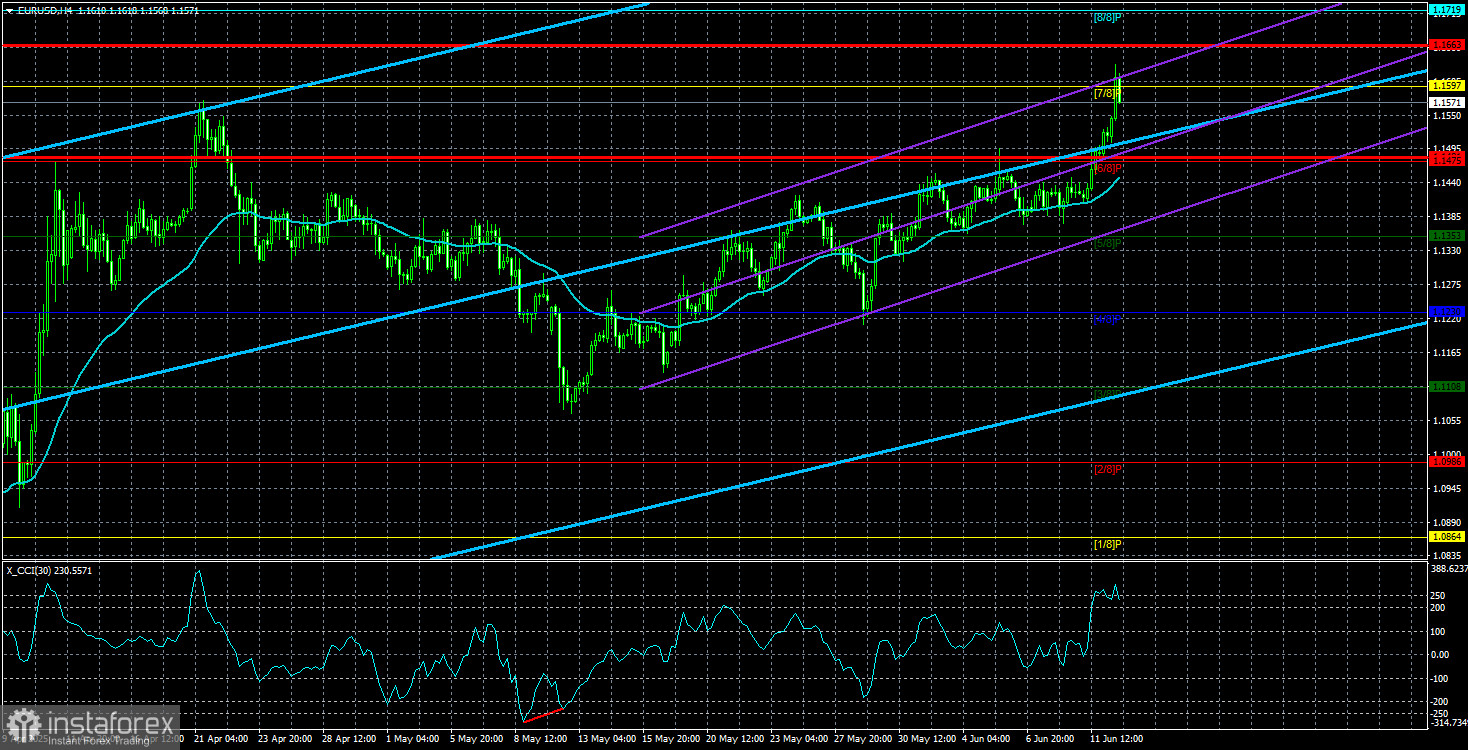
The EUR/USD currency pair continued its strong upward movement throughout Thursday. Is anyone still puzzled as to why the U.S. dollar keeps falling? From our point of view, the reasons are obvious and don't even require deep analysis. Essentially, there's only one reason — Donald Trump. Before Trump became president of the U.S. for a second time, the dollar was preparing to storm parity with the euro. And this was a realistic goal, considering the growth rates of the U.S. and European economies. However, the new-old leader of the U.S. took immediate action, and the markets tumbled.
While the U.S. stock market recovered quickly (thanks to internal demand for still-attractive American equities), the dollar was not so lucky. In fact, Trump is probably satisfied with the results of his first four months in office. The dollar is plummeting, and even during his first term he wanted to weaken the currency by pushing the Federal Reserve to lower rates, arguing that U.S. goods were too expensive for foreign buyers. Now the dollar has significantly depreciated, and stock markets have hardly lost anything. Is it time to declare victory?
But it's far too early for that. Not a single trade deal has been signed so far, and the U.S. may declare a default on its external obligations this summer. The economy slowed by 0.3% in the first quarter after several years of steady 2–3% quarterly growth. Inflation is rising — albeit slowly (which is lucky for the U.S. economy, considering the volume of tariffs). High inflation combined with low economic growth equals stagflation. So we can say this: Trump has achieved some of his goals, but who in the U.S. benefits? Who will thank Trump for higher inflation, slower economic growth, domestic instability, protests, and unrest in many American cities?
As for the dollar and its movement on the forex market, things are now quite straightforward. Nothing is protecting the U.S. currency from further declines. Even positive fundamental and macroeconomic data, which do occasionally appear, are only enough to trigger minor corrections. So, the renewed dollar collapse does not surprise us at all. The market stayed flat for several days, waited for the inflation report (which was relatively neutral), and then rushed to sell off the dollar again.
We believe the market is no longer focusing on the timing of news releases. The fundamental backdrop is so clear that the market uses it as a comprehensive layer of information without caring when specific news comes out. Today, there was word of dubious "progress" in U.S.–China negotiations, and the dollar didn't fall? No problem! It will fall tomorrow or the day after. The market ranges for a few days? Rest assured, the pair will resume growth regardless of any chart patterns.
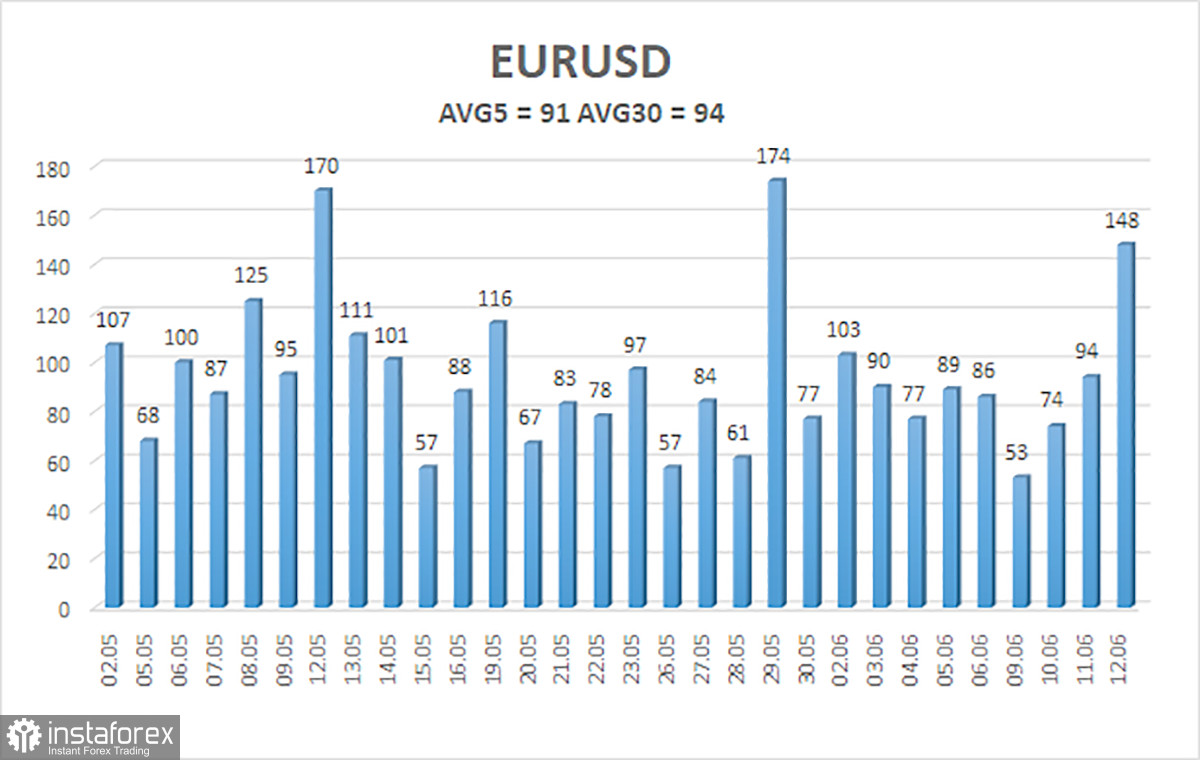
The average volatility of the EUR/USD pair over the last five trading days as of June 13 is 91 pips, classified as "moderate." We expect the pair to move between 1.1481 and 1.1663 on Friday. The long-term regression channel is pointing upward, still indicating a bullish trend. The CCI indicator dipped into oversold territory and formed a bullish divergence, which triggered the trend's continuation.
S1 – 1.1475
S2 – 1.1353
S3 – 1.1230
R1 – 1.1597
R2 – 1.1719
R3 – 1.1841
The EUR/USD pair remains in an upward trend. The U.S. dollar continues to be heavily influenced by Trump's domestic and foreign policies. Moreover, the market interprets most data negatively for the dollar. We observe a complete unwillingness from the market to buy the dollar under any circumstances. If the price is below the moving average, short positions toward 1.1353 remain relevant — although a significant drop is unlikely under current conditions. If the price is above the moving average, long positions toward 1.1663 and 1.1719 can be considered in continuation of the trend.
Linear Regression Channels help determine the current trend. If both channels are aligned, it indicates a strong trend.
Moving Average Line (settings: 20,0, smoothed) defines the short-term trend and guides the trading direction.
Murray Levels act as target levels for movements and corrections.
Volatility Levels (red lines) represent the likely price range for the pair over the next 24 hours based on current volatility readings.
CCI Indicator: If it enters the oversold region (below -250) or overbought region (above +250), it signals an impending trend reversal in the opposite direction.


