See also

 17.06.2025 06:38 AM
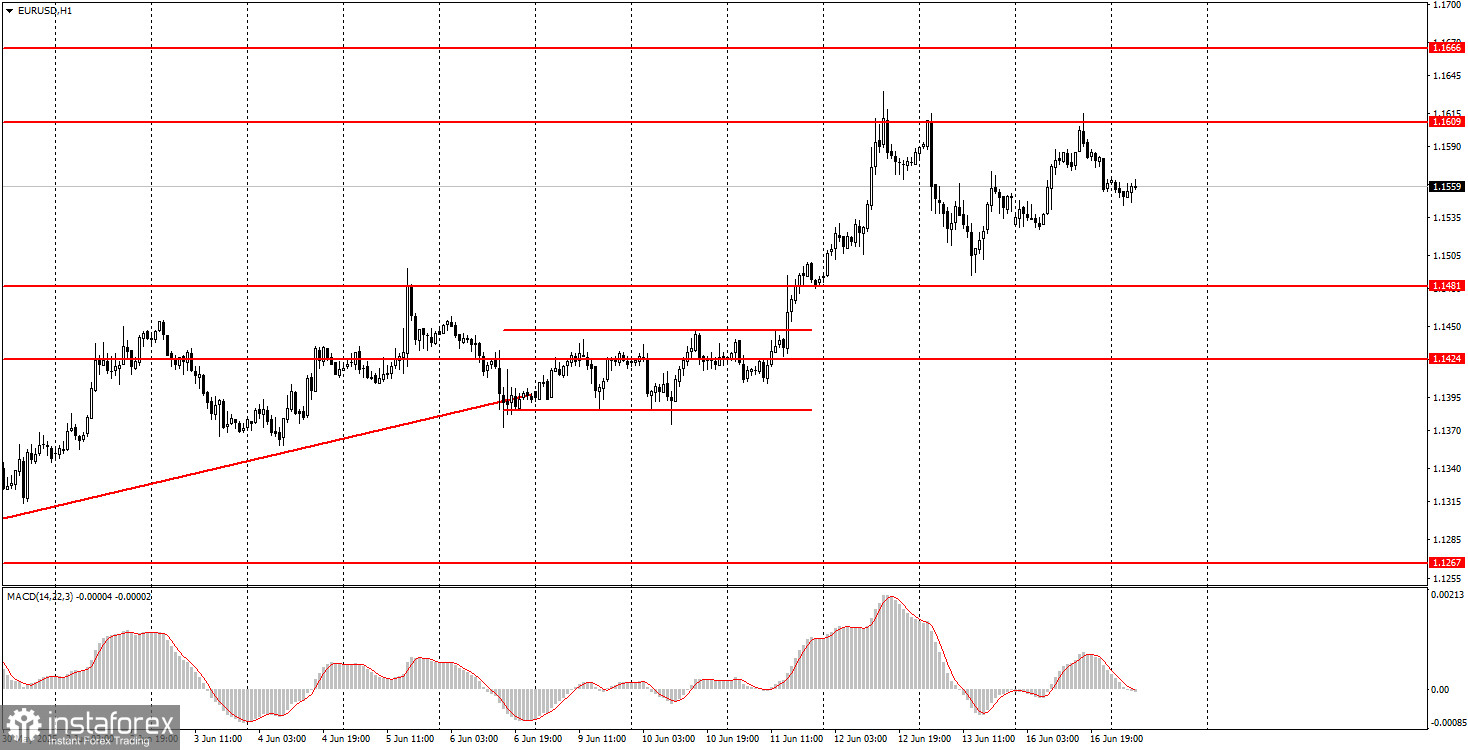
On Monday, the EUR/USD currency pair continued the upward movement that began in the second half of Friday. However, the bulls failed to break above the 1.1609 level for the third time. It is becoming clear that the euro has reached a certain limit amid the falling U.S. dollar. For the rally to continue, new negative data from across the Atlantic is needed—and frankly, we don't doubt that it will arrive soon. Given the upcoming Federal Reserve meeting this week, the wait may not be long.
For the past four months, the dollar has been falling not only when there are solid fundamental or macroeconomic reasons. The market often sells off the U.S. currency based on the overall backdrop. For example, even if Donald Trump hasn't made any loud statements or raised tariffs, the dollar still declines because the overall state of affairs in the U.S. remains bleak. Therefore, even if Powell maintains a "moderately hawkish" tone this week, the dollar may still come under pressure.
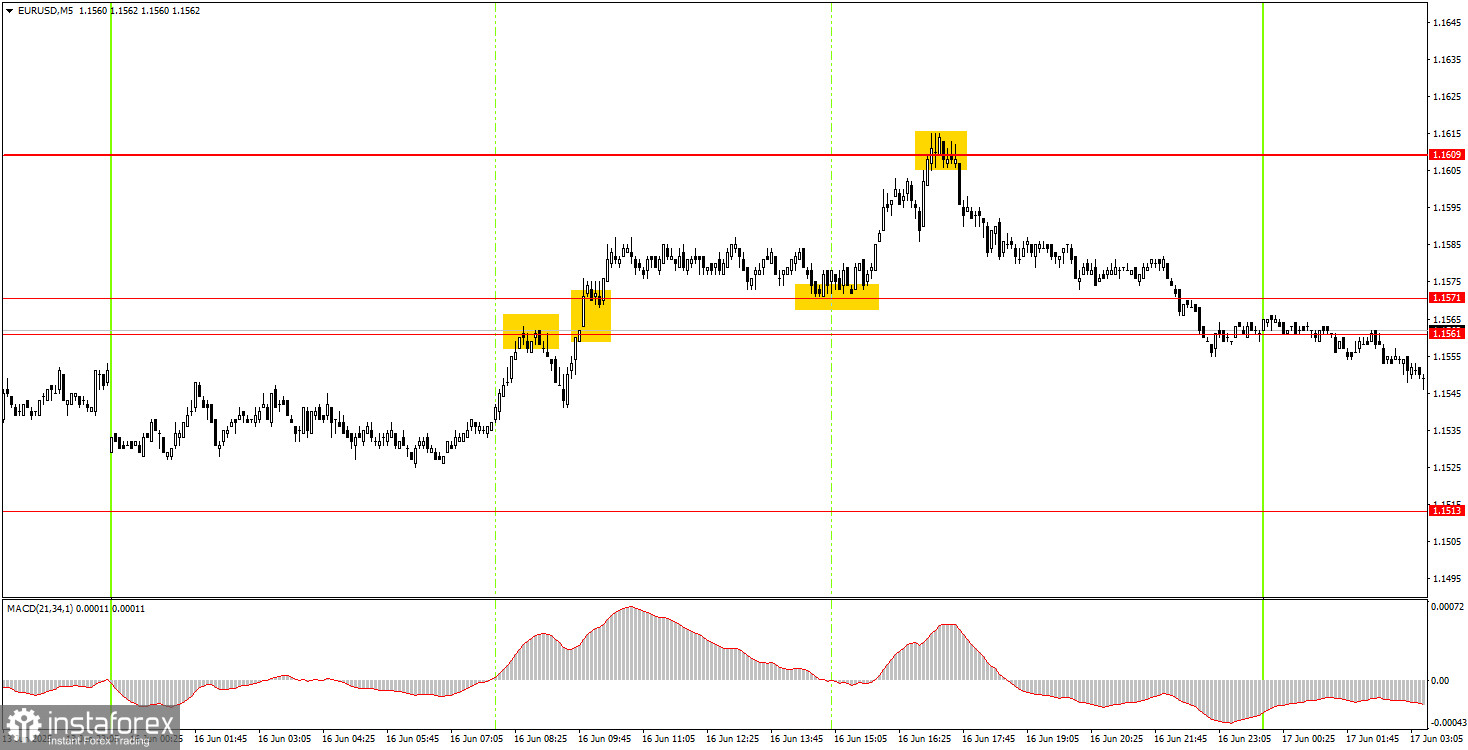
In the 5-minute timeframe, several decent trading signals were generated on Monday. The first sell signal was false, but the following three were accurate. The second and third signals overlapped, allowing just one buy position to open. A rebound from the 1.1609 level—the third in recent days—triggered a notable decline. As a result, two trades were profitable, and one was a loss.
On the hourly timeframe, EUR/USD continues its uptrend, which began under Trump and, it seems, will not end during his presidency. The fact that Trump remains president is still enough to cause the U.S. dollar to decline regularly. The escalating conflict between Iran and Israel has not impacted the dollar's overall trajectory. The U.S. leader continues to threaten, issue ultimatums, raise tariffs, and push through other high-profile decisions. Therefore, while the market may not sell the dollar daily, it certainly isn't buying it with a medium-term outlook either.
On Tuesday, the EUR/USD pair may trade more moderately and stay below the 1.1609 level. With only a few macroeconomic reports due, volatility could decrease as well.
In the 5-minute timeframe, the following levels should be considered: 1.1132–1.1140, 1.1198–1.1218, 1.1267–1.1292, 1.1354–1.1363, 1.1413–1.1424, 1.1474–1.1481, 1.1513, 1.1561–1.1571, 1.1609, 1.1666, 1.1704, 1.1802. On Tuesday, the Eurozone will release only secondary economic sentiment indices, while the U.S. will publish slightly more important data on industrial production and retail sales. However, the market continues to sell the dollar based on entirely different factors.
Support and Resistance Levels: These are target levels for opening or closing positions and can also serve as points for placing Take Profit orders.
Red Lines: Channels or trendlines indicating the current trend and the preferred direction for trading.
MACD Indicator (14,22,3): A histogram and signal line used as a supplementary source of trading signals.
Important Events and Reports: Found in the economic calendar, these can heavily influence price movements. Exercise caution or exit the market during their release to avoid sharp reversals.
Forex trading beginners should remember that not every trade will be profitable. Developing a clear strategy and practicing proper money management are essential for long-term trading success.


