See also

 25.06.2025 03:35 AM
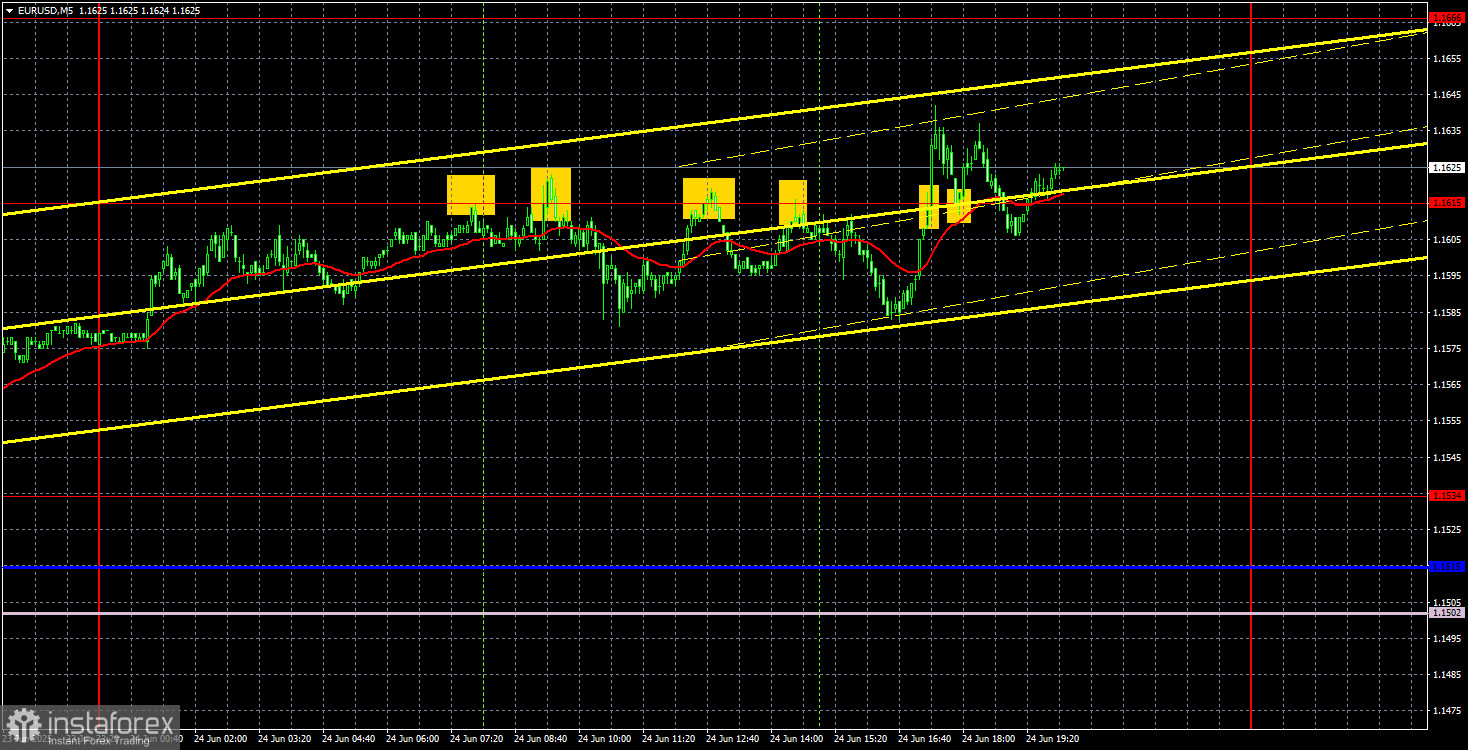
The EUR/USD currency pair traded relatively calmly throughout most of Tuesday, though there were still some "spikes." The first significant "spike" in recent days occurred Monday evening when the market first fully reacted to the U.S. strike on Iranian nuclear facilities, followed by Iran's retaliatory attack on American military bases. As I mentioned, the U.S. entering a military conflict in the Middle East could not inspire optimism for dollar bulls. In the second half of Tuesday, the U.S. dollar strengthened slightly, which may have been related to Jerome Powell's testimony before the U.S. Congress. Although the Federal Reserve Chair's rhetoric hardly changed, the dollar recovered somewhat from its recent lows.
However, we believe technical factors played a role yesterday. Just look—even on the hourly timeframe, there were four clear bounces off the 1.1615 level. It's easy to conclude that this level serves as a sort of ceiling for buyers, above which it's very difficult to advance. No matter how weak the dollar may be under Trump, it can't lose 1,000 points every quarter. We are still discussing the currency of the world's strongest economy, even if Americans may have made a mistake in their choice of president... again.
Ultimately, this is an issue for the U.S. and its citizens to address, not for us. From a technical standpoint, the recent weeks' movements increasingly resemble a flat range between 1.1450 and 1.1615. However, given the flurry of events during that time, the flat could have formed coincidentally. Either way, the dollar still lacks strong reasons for significant growth, so any buy signal should be acted upon. If the 1.1615 level is breached, it would signal a continuation of the 5-month trend.
Four sell signals were formed near the 1.1615 level yesterday in the 5-minute timeframe, duplicating each other. Traders could have opened short positions, but they resulted in neither profit nor loss. Later, two buy signals formed near the same level, though those were likely not worth acting on.
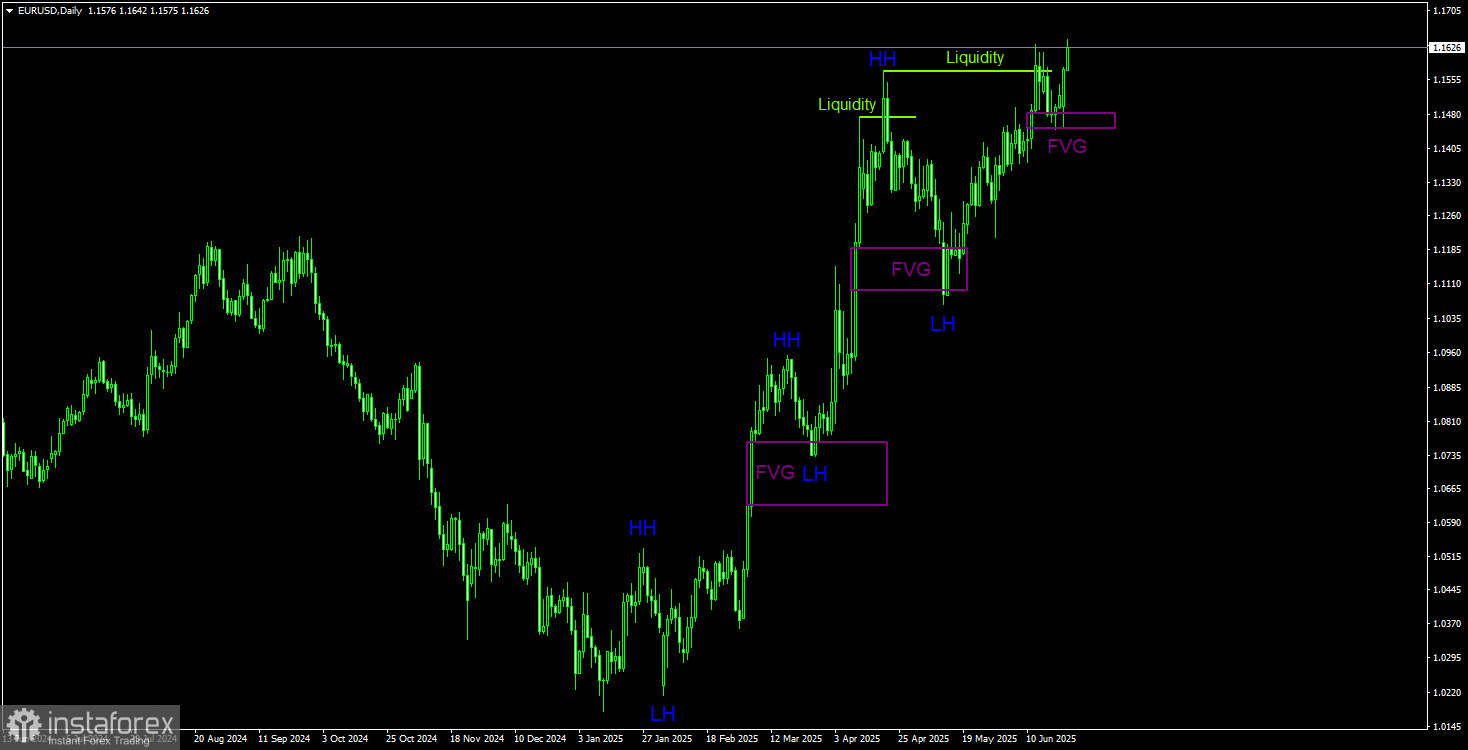
In the long term, we see a clear upward trend. Of course, every bullish trend ends eventually, but the only sign of a possible decline is a liquidity grab from the last higher high (HH). A bullish Fair Value Gap (FVG) zone is a potential bullish signal. A rebound from this area indicates a resumption of euro growth. Considering the market's complete unwillingness to buy the dollar, the bullish trend structure will likely remain relevant for quite some time. Therefore, any short-term dollar strength will likely not significantly affect the prevailing trend. The broader fundamental backdrop continues to weigh against the U.S. dollar.
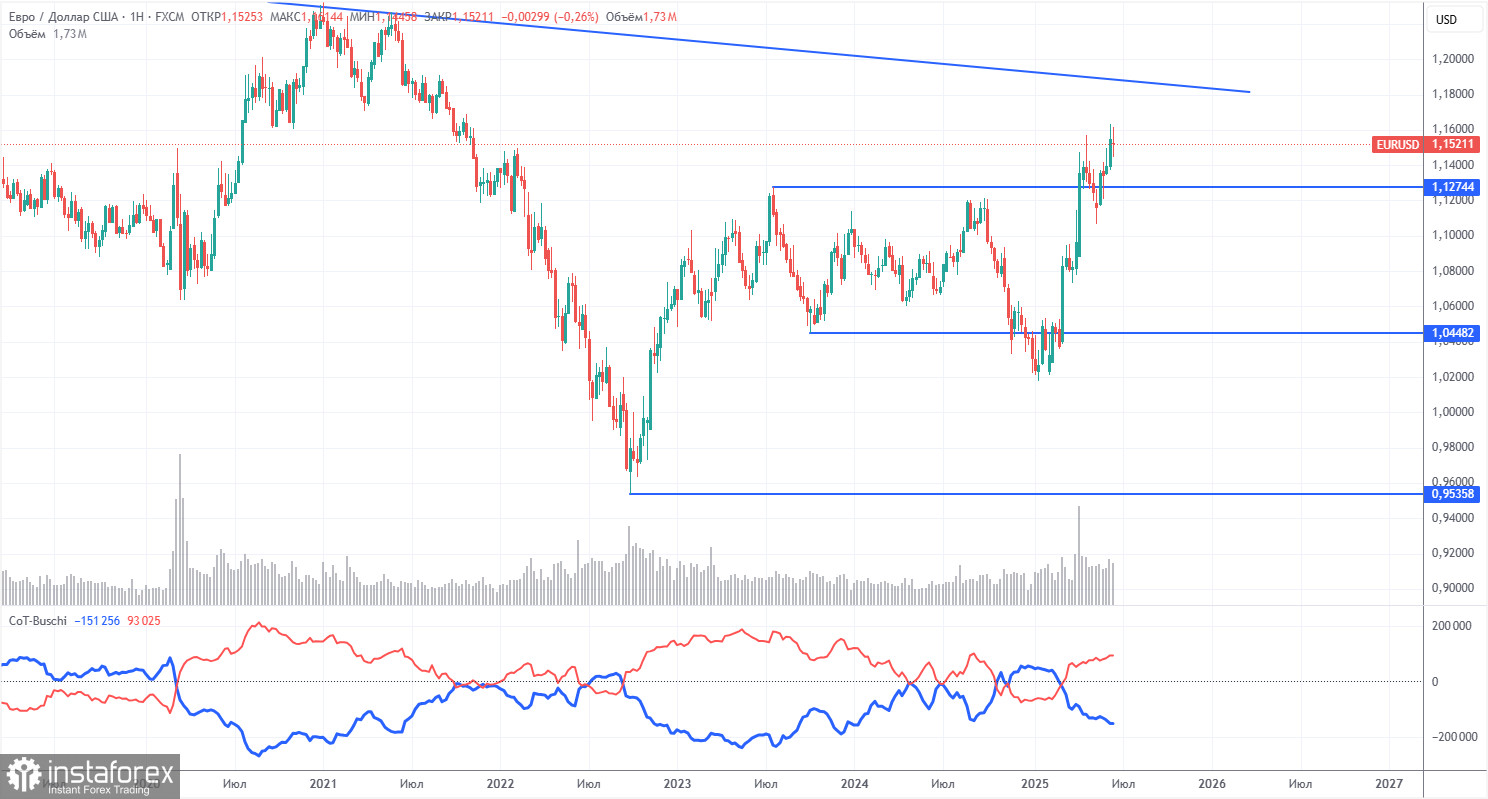
The most recent COT report is dated June 10. The chart above shows that the net position of non-commercial traders has long been bullish. Bears gained the upper hand briefly at the end of 2024 but quickly lost it. Since Trump assumed the presidency, only the dollar has been falling. We cannot say with 100% certainty that the dollar will continue to fall, but current global events suggest this scenario is likely.
We still see no fundamental reasons for the euro to strengthen. However, there is a powerful fundamental reason for the dollar to decline. The global downtrend remains intact—but what relevance does the past 16 years of price action have now? Once Trump ends his trade wars, the dollar could begin to rise. But will Trump ever end them? And when?
The red and blue lines have crossed again, signaling a renewed bullish trend. During the latest reporting week, the number of longs held by the "Non-commercial" group increased by 6,000, and the number of shorts decreased by 4,300. As a result, the net position rose by 10,300 over the week.
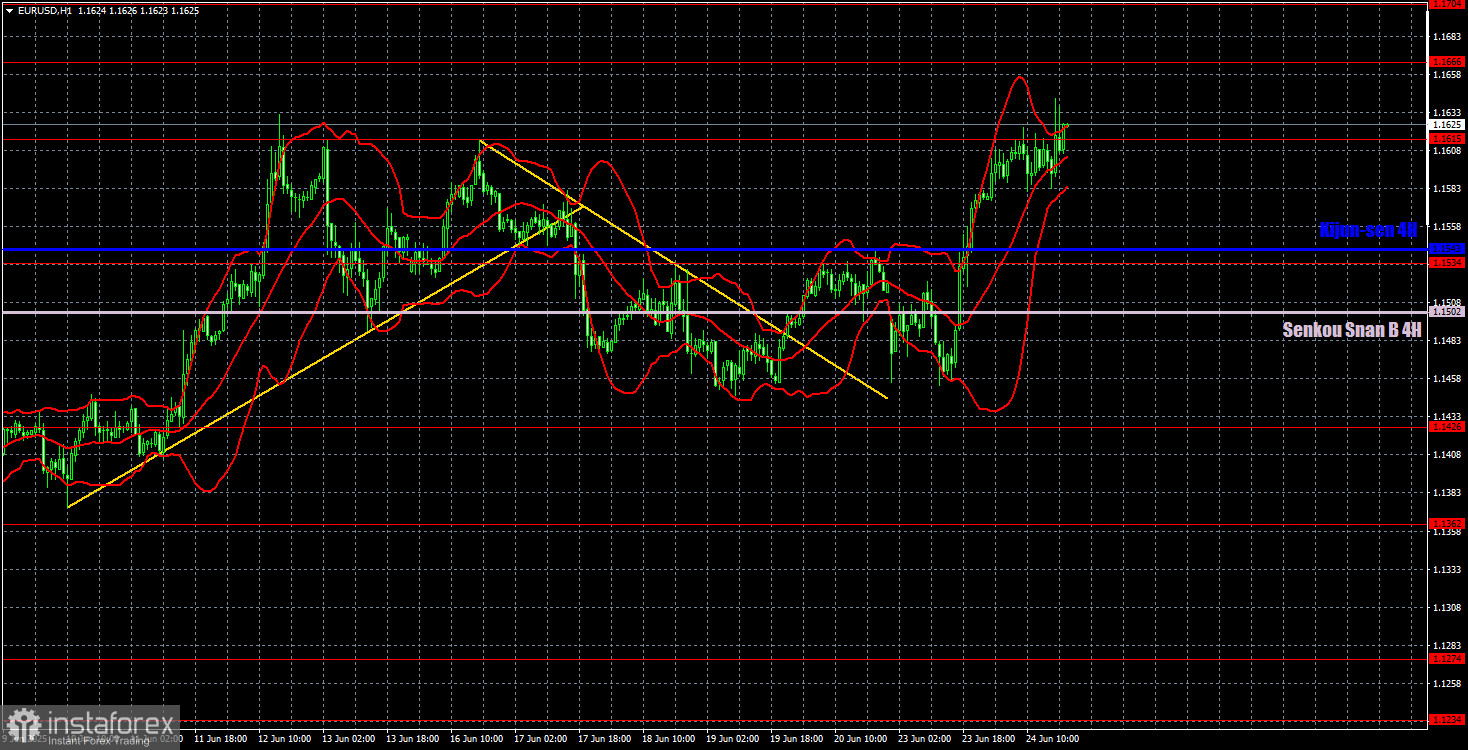
On the hourly timeframe, EUR/USD began forming a local downtrend, which then ended. On the daily chart, the pair bounced off the FVG area, so further growth is likely in the near future. The hourly chart shows signs of a flat, but breaking through 1.1615 would open the path for bulls. The official entry of the U.S. into war against Iran didn't support the dollar as many expected. Technically, the odds of further growth for the pair are much higher.
Key Levels for Trading on June 25: 1.1092, 1.1147, 1.1185, 1.1234, 1.1274, 1.1362, 1.1426, 1.1534, 1.1615, 1.1666, 1.1704, 1.1750. Ichimoku Lines: Senkou Span B (1.1502) and Kijun-sen (1.1543). Note: Ichimoku indicator lines can shift throughout the day and should be considered when identifying trade signals. Don't forget to set your Stop Loss to breakeven once the price moves 15 pips in the right direction. This protects against losses if the signal turns out to be false.
Wednesday's key event will be Powell's second appearance before the U.S. Congress. However, we don't expect anything new from this testimony—it's likely to repeat the same statement made yesterday.


