See also

 21.07.2025 08:12 AM
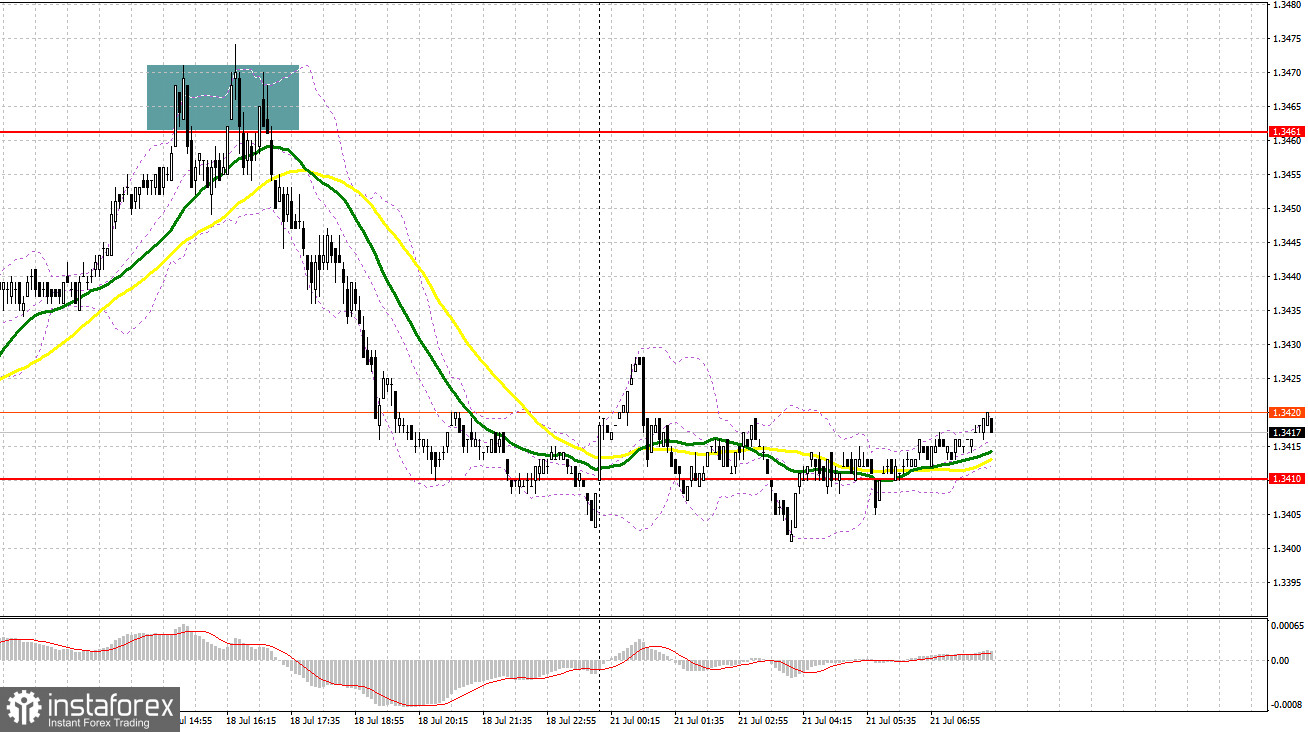
Last Friday, only one entry point into the market was formed. Let's look at the 5-minute chart and analyze what happened. In my morning forecast, I highlighted the 1.3442 level and planned to make trading decisions based on it. The pair did rise to the area around 1.3442, but no false breakout occurred there. In the second half of the day, a failed consolidation near 1.3461 triggered a sell signal, resulting in a more than 50-pip decline in the pound.
Pressure on the British pound quickly returned due to ongoing economic challenges and the likelihood of more aggressive rate cuts, which continue to weigh on the GBP/USD pair. With no UK data scheduled for today, the pair is likely to remain in a sideways channel, keeping the door open for further decline.
If the pair moves lower, I will consider buying only after a false breakout forms near 1.3402—support established last Friday. This would serve as a signal to open long positions with the target of recovering toward the 1.3444 resistance level. A breakout and retest from top to bottom of this range would revive the chances of GBP/USD growth, triggering stop orders from sellers and forming a good entry point for long positions with the potential to reach 1.3472. The final target will be the area around 1.3502, where I will take profit.
If GBP/USD continues to fall and shows no activity near 1.3402, pressure on the pound will intensify, likely pushing the pair down toward the weekly low of 1.3368. Only a false breakout at that level would present a valid condition for opening long positions. I plan to buy GBP/USD immediately on a rebound from the 1.3335 low, targeting a 30–35 pip intraday correction.
Sellers showed their hand last Friday by taking advantage of attractive prices, indicating that pressure on the pair remains and the bearish trend is likely to continue. If another upward correction occurs, I plan to act near the closest resistance at 1.3444. A false breakout at that level would be a suitable signal to open short positions targeting support at 1.3402, where the moving averages—currently favoring sellers—are also located.
A breakout and retest from below would hit buyers' positions, trigger stop orders, and open the path to 1.3368, reinforcing the bearish market. The final target will be 1.3335, at which point I will take profit.
If GBP/USD rises and there is no bearish activity near 1.3444, buyers will likely try to achieve a stronger recovery. In this case, it's better to postpone short positions until the 1.3472 resistance is tested. I plan to sell there only after a failed consolidation. If there is no downward movement at that level either, I will sell GBP/USD immediately on a rebound from 1.3502, targeting a 30–35 pip correction.
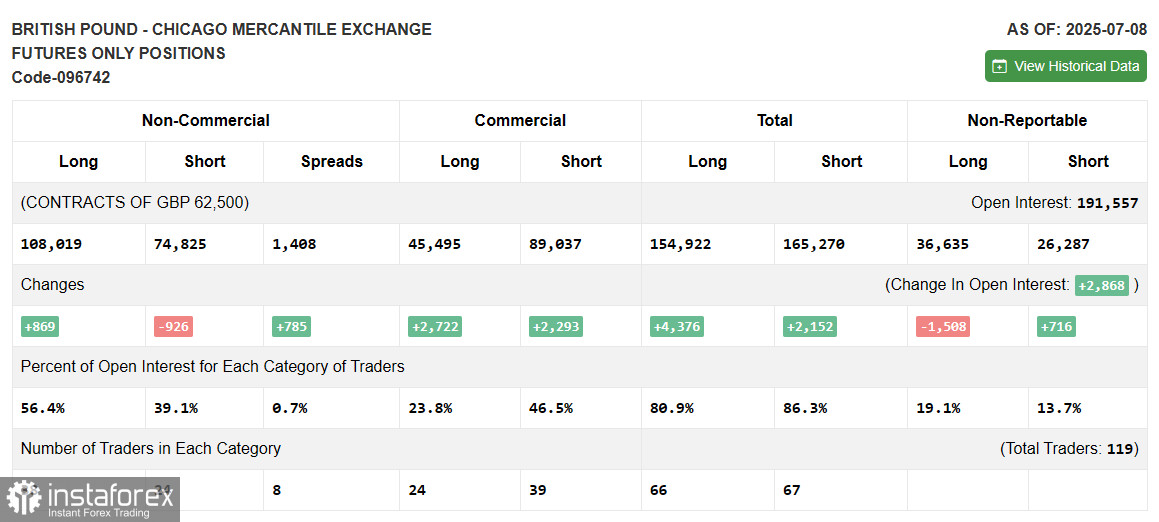
In the COT (Commitment of Traders) report for July 8, there was an increase in long positions and a slight reduction in short ones. However, since the pound has been falling for eight consecutive trading days, the actual data likely diverges from the report figures and should be interpreted cautiously.
The pound's decline is mainly due to the sharp rise in expectations for more aggressive rate cuts by the Bank of England, driven by slowing UK economic growth. This trend will likely continue in the near term. The Federal Reserve's plans to keep interest rates unchanged are supporting the dollar and putting further pressure on the pound.
The latest COT report shows:
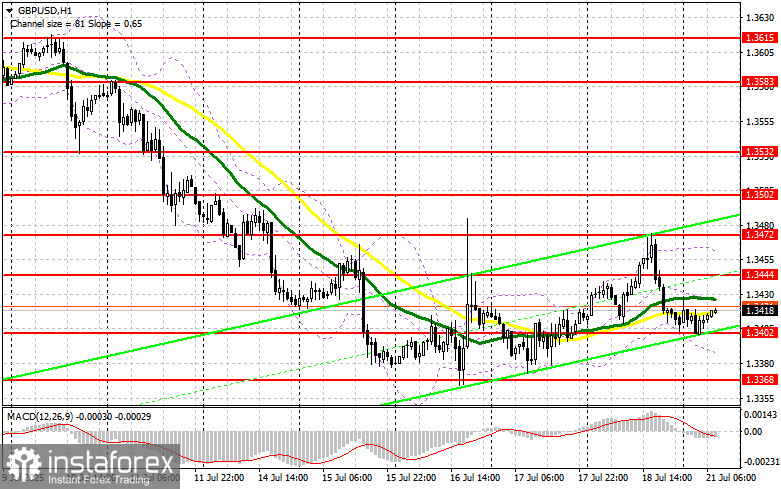
Moving Averages
Trading is occurring near the 30- and 50-period moving averages, indicating a continued sideways market.
Note: The author uses hourly (H1) moving averages, which differ from the classical daily (D1) moving average definitions.
Bollinger Bands
If the pair declines, the lower boundary of the indicator near 1.3390 will act as support.


