See also

 30.07.2025 06:59 AM
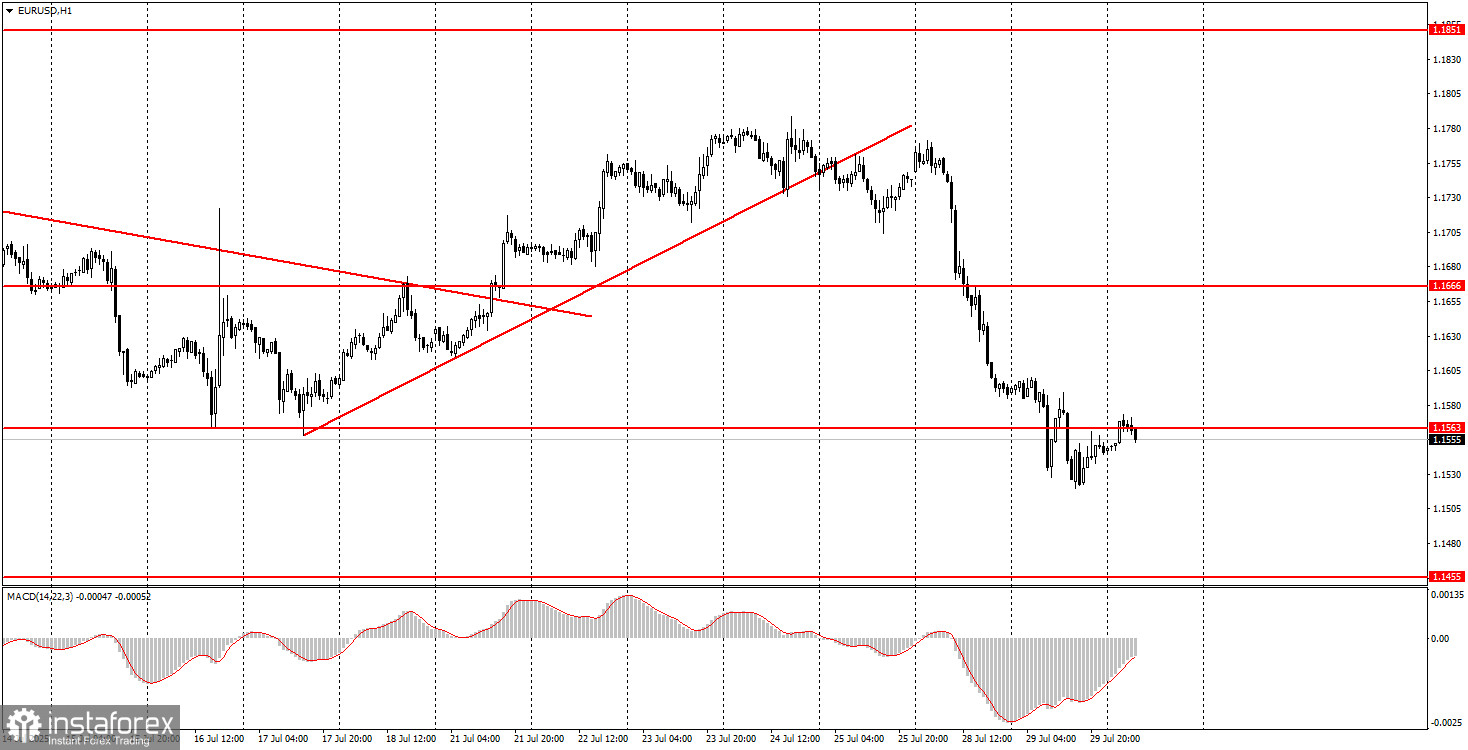
On Tuesday, the EUR/USD currency pair continued its decline, although not at the same pace as on Monday. Recall that on Monday, the trade agreement between the EU and the US was announced, which many experts and politicians described as oppressive for the Eurozone. It was this agreement that triggered a sharp decline in the euro across the market and a rise in the dollar. We anticipated that the market would continue to react to this event on Tuesday, and that's precisely what happened. However, the dollar cannot continue rising indefinitely on a single event. Let's recall that the main reason for the decline in the US dollar over the past six months was not the trade war itself, but Donald Trump's protectionist policy, which drastically reduced the global appetite for dealing with an unstable and unpredictable dollar. The trade war, of course, will affect both the US and global economies, and the trade deal with the EU implies the same tariffs that were in place before the agreement — or even higher.
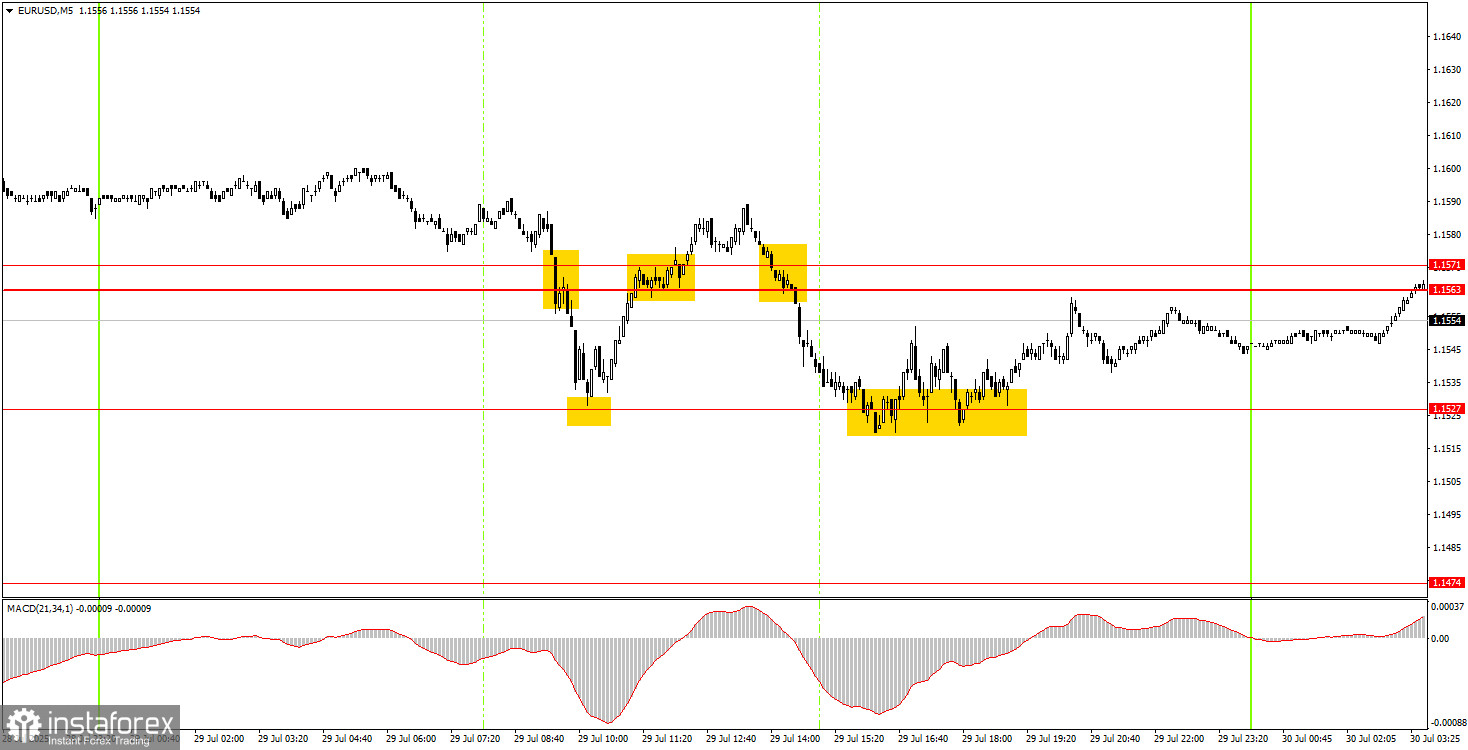
In the 5-minute timeframe, a considerable number of trading signals were formed on Tuesday. At the start of the European trading session, novice traders already had the opportunity to sell the pair. Just 15 minutes later, the price reached the 1.1527 level, rebounded, and long positions could be opened. Then a new sell signal was formed near the 1.1563–1.1571 area, after which the price again worked out the 1.1527 level. A new rebound — another opportunity to open longs — and the price returned to 1.1563 once again. Thus, traders could open four trades on Tuesday, all of which turned out to be profitable.
In the hourly timeframe, the EUR/USD pair has resumed a downward correctional movement, prompted by the news of the EU–US trade deal signing. Since Trump's policy has not changed recently, and themes like the confrontation with Powell and the ongoing trade war remain relevant, we still see little reason for the dollar to appreciate in the medium term. Therefore, in the short term, the dollar may continue rising, but in the long term, it's unlikely.
On Wednesday, the EUR/USD pair may continue its local downward pullback, and we advise novice traders to monitor the 1.1563–1.1571 area closely. A rebound from this zone would allow traders to open short positions, targeting 1.1527 and 1.1474. If the price consolidates above this zone, new long positions can be considered, targeting 1.1655–1.1666.
On the 5-minute timeframe, watch the following levels: 1.1198–1.1218, 1.1267–1.1292, 1.1354–1.1363, 1.1413, 1.1455–1.1474, 1.1527, 1.1563–1.1571, 1.1655–1.1666, 1.1740–1.1745, 1.1808, 1.1851, 1.1908.
On Wednesday, Germany, the Eurozone, and the US are scheduled to publish Q2 GDP reports, and the FOMC will announce its meeting results in the US. Therefore, there will be many important events today.
Support and Resistance Levels: These are target levels for opening or closing positions and can also serve as points for placing Take Profit orders.
Red Lines: Channels or trendlines indicating the current trend and the preferred direction for trading.
MACD Indicator (14,22,3): A histogram and signal line used as a supplementary source of trading signals.
Important Events and Reports: Found in the economic calendar, these can heavily influence price movements. Exercise caution or exit the market during their release to avoid sharp reversals.
Forex trading beginners should remember that not every trade will be profitable. Developing a clear strategy and practicing proper money management are essential for long-term trading success.


