See also


 31.07.2025 01:37 PM
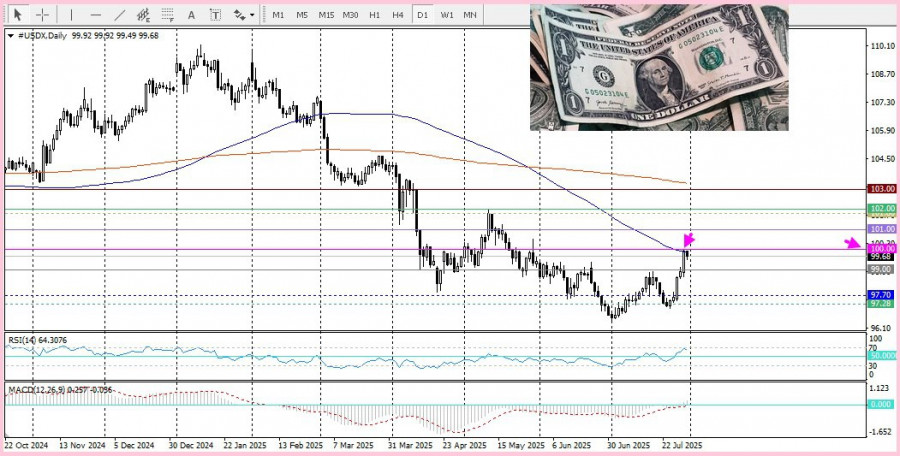
Today, gold continues a steady intraday recovery, having retraced a significant portion of the previous day's losses. At the same time, the U.S. dollar is slightly weakening as market participants take profits following the hawkish rally triggered by the Federal Reserve's statement, which pushed the dollar index to a two-month high.
This factor is providing some support to gold prices. The strengthening of gold is largely overshadowing the prevailing positive market sentiment, which typically weighs on this safe-haven asset. However, expectations of a Fed rate cut in September may limit a deeper dollar correction and act as a restraining factor on further downside in gold prices. The Federal Reserve kept its benchmark interest rate unchanged at 4.25%–4.50% for the fifth consecutive meeting. This decision was made despite pressure from President Donald Trump and his supporters, who have been pushing for lower borrowing costs. For the first time since 1993, two Fed governors — Michelle Bowman and Christopher Waller — dissented from the majority decision, marking a notable departure from consensus.
In its accompanying monetary policy statement, the Committee expressed a more optimistic view of the economy, citing solid growth and continued positive macroeconomic trends. Following the meeting, Fed Chair Jerome Powell stated that a rate cut is not planned for September, which supported the U.S. dollar and helped it reach a two-month high.
Additional optimism came from strong data: Automatic Data Processing reported a 104,000 increase in U.S. private-sector jobs in July (after a revised drop of 23,000 the previous month). A preliminary Commerce Department report also showed U.S. GDP growth of 3.0% year-over-year in Q2, following a 0.5% contraction in Q1. These figures reinforced expectations of the Fed maintaining its monetary policy course and further supported the dollar.
Looking ahead, traders should wait for the release of key U.S. economic data, which will likely influence the next directional move for the XAU/USD pair and help define the next stage of price action.
From a technical standpoint, the precious metal is finding some support near the 100-day simple moving average (SMA) and appears to have temporarily halted its decline following the FOMC decision. However, the Relative Strength Index (RSI) on the daily chart is beginning to turn lower, suggesting that any upward movement beyond the psychological level of $3300 is likely to face selling pressure and remain capped near the $3315 area. A sustained move above this resistance zone could trigger a rally, prompting short-covering and pushing prices toward the next key level at $3330.
On the other hand, the $3275 level near the 100-day SMA will likely continue to offer support. A drop below this level would expose gold to a retest of the June low around $3245–3248. This zone will be a key pivot; a decisive break below it would become a new bearish trigger, opening the path toward the psychological level of $3200.
You have already liked this post today
*The market analysis posted here is meant to increase your awareness, but not to give instructions to make a trade.


