See also

 15.08.2025 06:13 AM
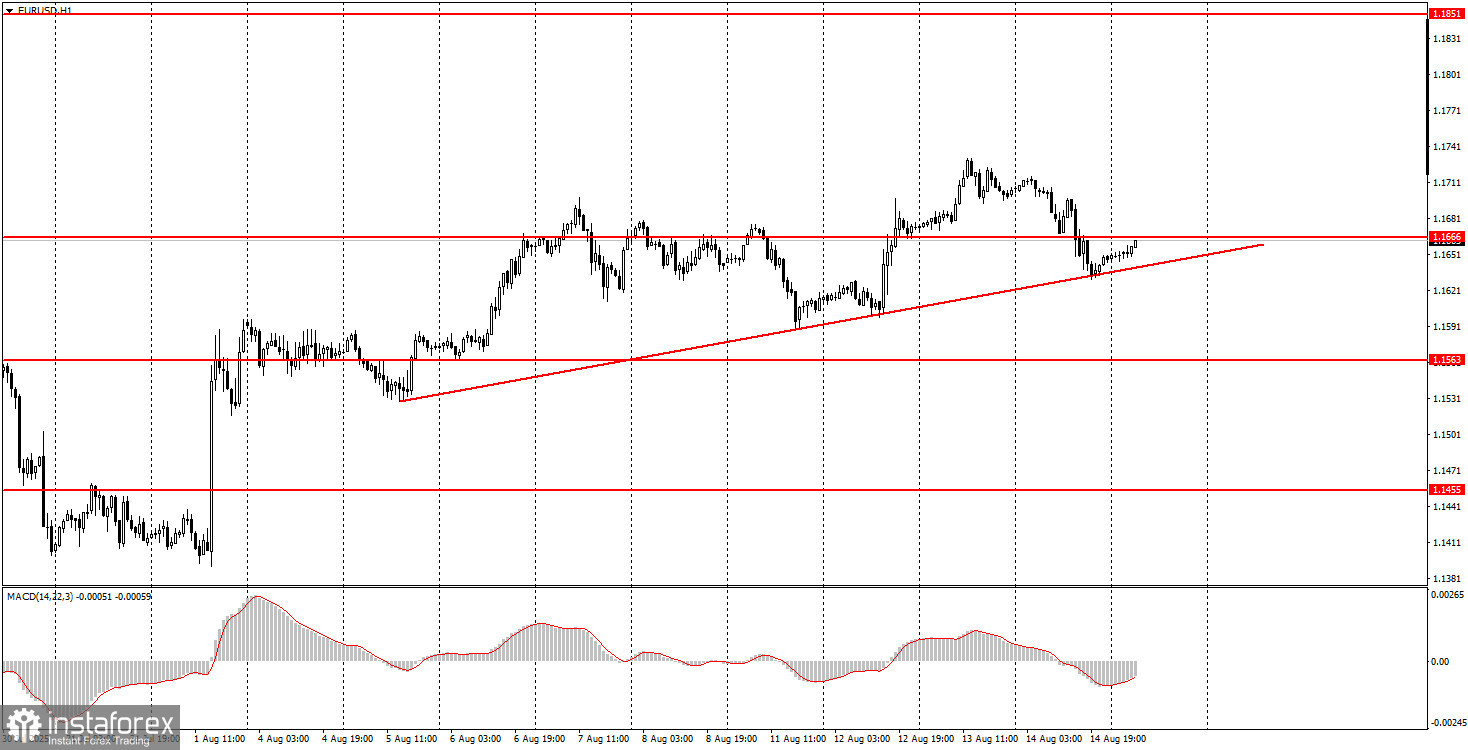
On Thursday, the EUR/USD currency pair traded lower. Four macroeconomic reports were published during the day, three of which had no impact on the pair's movement. Only the fourth report — the Producer Price Index — had an effect. We had assumed that even this indicator would not trigger any market reaction, but this time its value turned out to be highly significant and telling. The Producer Price Index rose by 0.9% month-on-month in July, marking the fastest acceleration in the past three years. The PPI indicates that U.S. producers, under the pressure of Trump's trade war, have begun raising prices. If so, overall inflation is also likely to increase in the coming months — perhaps not as sharply as it seemed a couple of months ago, but still. Formally, the PPI reduces the likelihood of a sharp Federal Reserve rate cut by the end of 2025. In practice, it changes nothing, because now the Fed's priority is to rescue the labor market. Therefore, we will almost certainly see monetary policy easing in September.
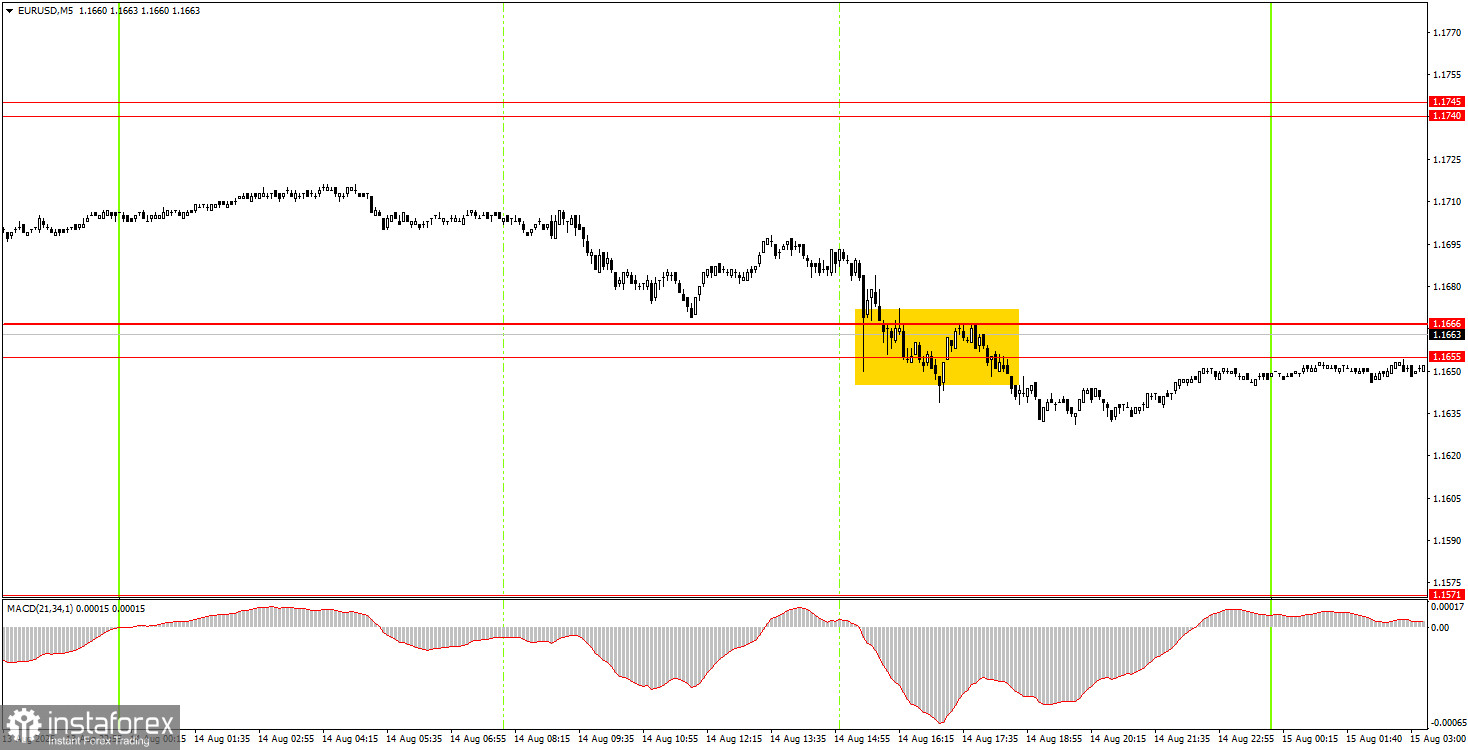
In the 5-minute time frame on Thursday, one sell signal was formed. During the U.S. trading session, the price broke through the 1.1655–1.1666 range, but on the hourly chart, it hit the ascending trendline. We believe the hourly time frame is more important, so selling positions should not have been opened. In our view, today the chances of a resumption of the local uptrend are much higher.
On the H1 chart, the EUR/USD pair has every chance to continue the uptrend that has been developing since the start of the current year. The U.S. dollar's "house of cards" collapsed two Fridays ago, and since then, the situation for the dollar has continued to worsen. The Fed may soon resume its cycle of monetary policy easing, while a de-escalation of the military conflict between Ukraine and Russia could increase demand for risk assets rather than for the dollar.
On Friday, EUR/USD may resume its upward movement after bouncing from the trendline. Thus, long positions remain relevant today with a target of 1.1851. Shorts may be considered if the price consolidates below the trendline, targeting 1.1563.
On the M5 chart, levels to watch are: 1.1198–1.1218, 1.1267–1.1292, 1.1354–1.1363, 1.1413, 1.1455–1.1474, 1.1527, 1.1552–1.1563–1.1571, 1.1655–1.1666, 1.1740–1.1745, 1.1808, 1.1851, 1.1908. For Friday, no significant events are scheduled in the Eurozone, while the U.S. will release relatively important reports on retail sales, industrial production, and the University of Michigan Consumer Sentiment Index.
Support and Resistance Levels: These are target levels for opening or closing positions and can also serve as points for placing Take Profit orders.
Red Lines: Channels or trendlines indicating the current trend and the preferred direction for trading.
MACD Indicator (14,22,3): A histogram and signal line used as a supplementary source of trading signals.
Important Events and Reports: Found in the economic calendar, these can heavily influence price movements. Exercise caution or exit the market during their release to avoid sharp reversals.
Forex trading beginners should remember that not every trade will be profitable. Developing a clear strategy and practicing proper money management are essential for long-term trading success.


