See also

 25.09.2025 03:27 AM
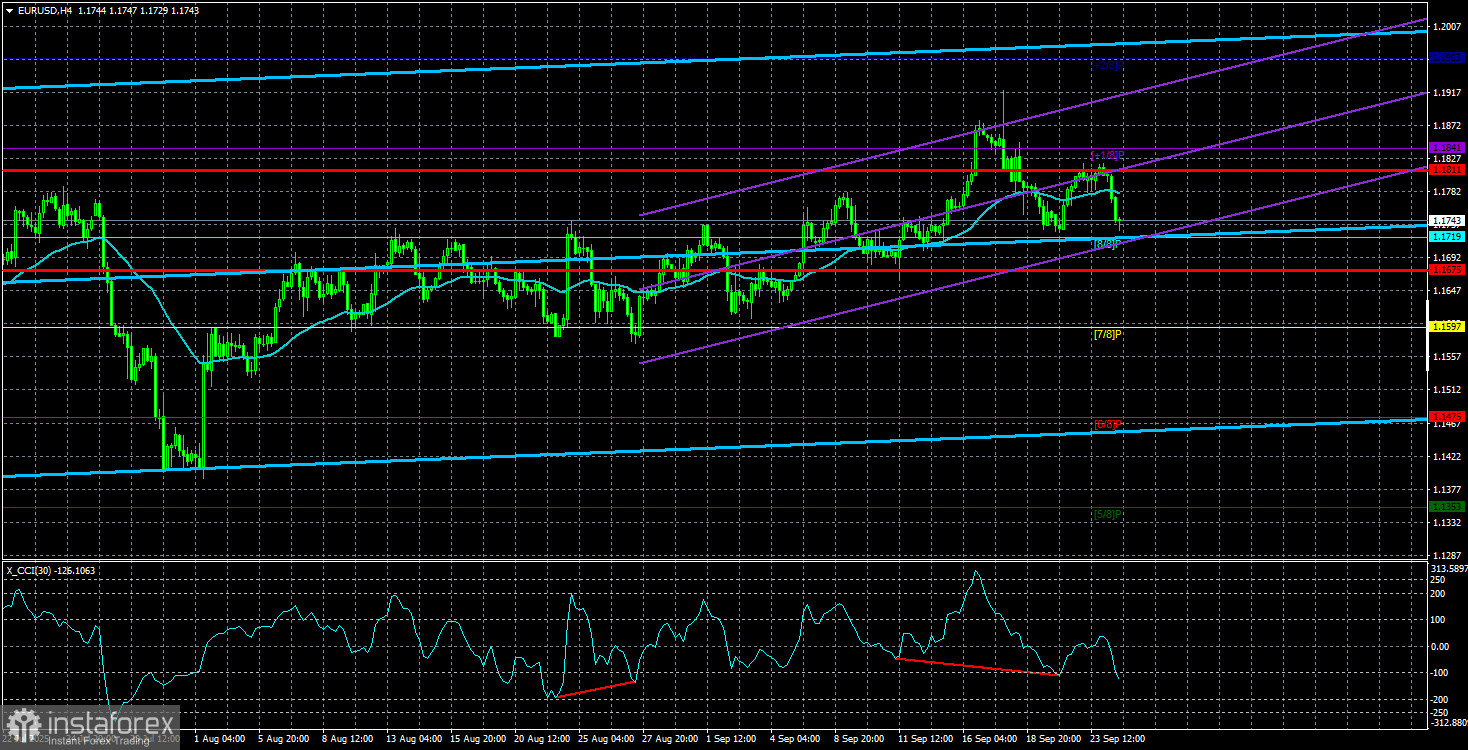
On Wednesday, the EUR/USD currency pair abruptly and unexpectedly resumed its downward movement, consolidating below the ascending trendline. It's fair to say there were no fundamental or macroeconomic reasons for such a move. On Wednesday, there were no significant events in either the US or the Eurozone, and the European currency began to fall almost right from the morning. The only thing that could have triggered such a drop was Jerome Powell's speech the previous day. However, we are skeptical of this explanation, since it's not typical for the market to wait almost an entire day to react to a Fed Chair's comments.
Traders really had nothing new to react to in Powell's remarks. His rhetoric had not changed at all from previous days since the last Fed meeting. There was nothing "hawkish" in Powell's speech, so the market could only use his remarks as an excuse to buy US dollars. In our view, there were no real reasons for the euro's decline last week or this week. Nonetheless, the price broke through both Ichimoku indicator lines and the ascending trendline. Therefore, the drop is very likely to continue.
On the 5-minute timeframe yesterday, two trading signals formed. The pair first broke the Senkou Span B line, and then the 1.1750–1.1760 area. Thus, traders had grounds to open short positions as early as the European session and could maintain those trades throughout the day. With the trendline now broken, it was reasonable to keep positions open in pursuit of higher profits.
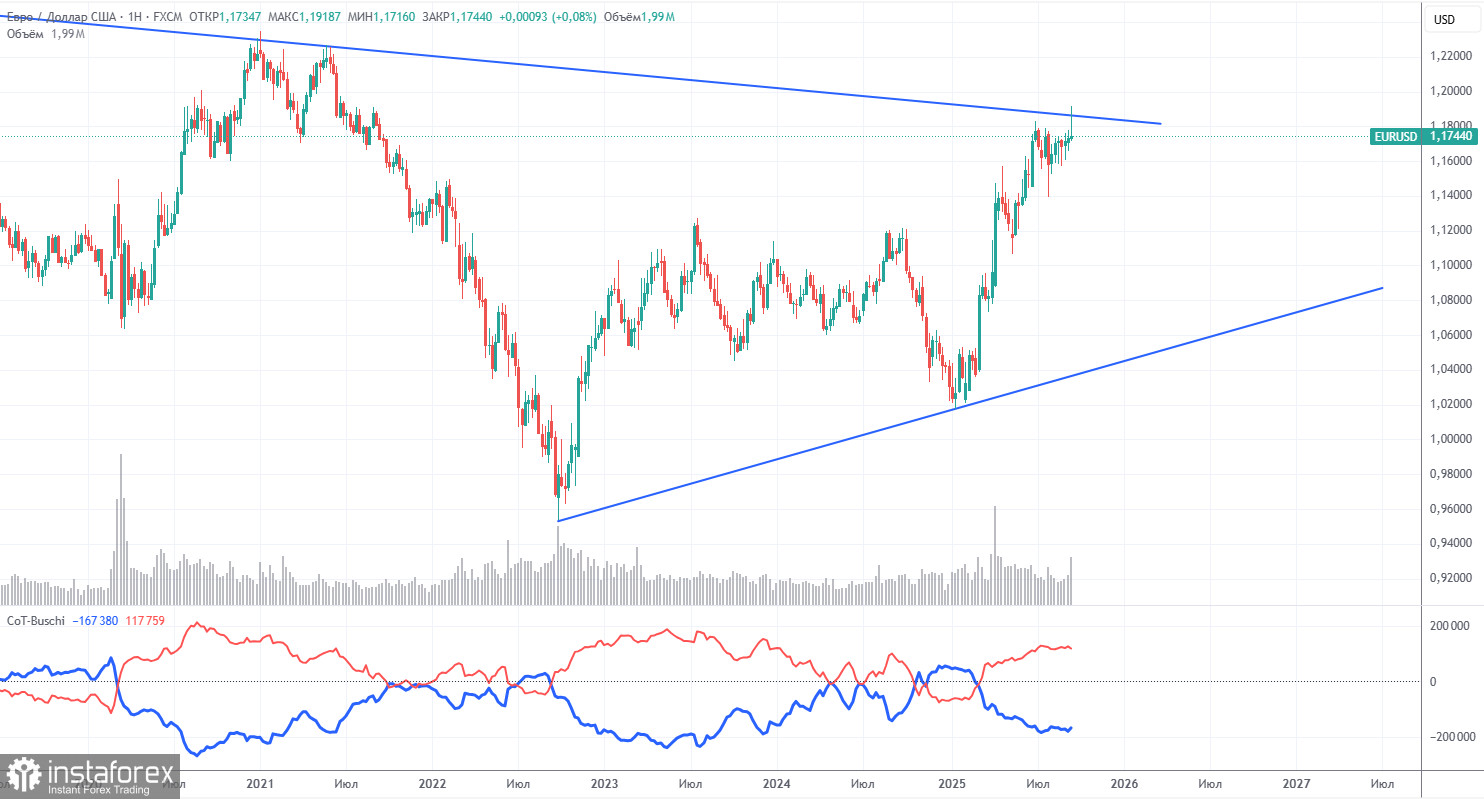
The latest COT report is dated September 16. The chart above clearly shows that the net position of non-commercial traders had long been bullish, with the bears only barely gaining the upper hand at the end of 2024—and they quickly lost it. Since Trump took office for a second time, the dollar has been the only one to fall. We can't say with 100% certainty that the dollar's decline will continue, but global events point to this scenario.
We still don't see any fundamental factors supporting the euro, but there remain plenty of reasons for the dollar to fall. The global downward trend remains intact, but at this point, what difference does it make that the price has been relatively stable for the past 17 years? Once Trump ends his trade wars, the dollar may be able to rally; however, recent developments indicate that trade wars will likely continue in one form or another. The potential loss of Fed independence is another major factor weighing on the US currency.
The red and blue lines of the indicator still point to a bullish trend. During the last reporting week, the "Non-commercial" group's number of longs dropped by 4,800, while shorts increased by 3,100, bringing the net position down by 7,900 contracts for the week.
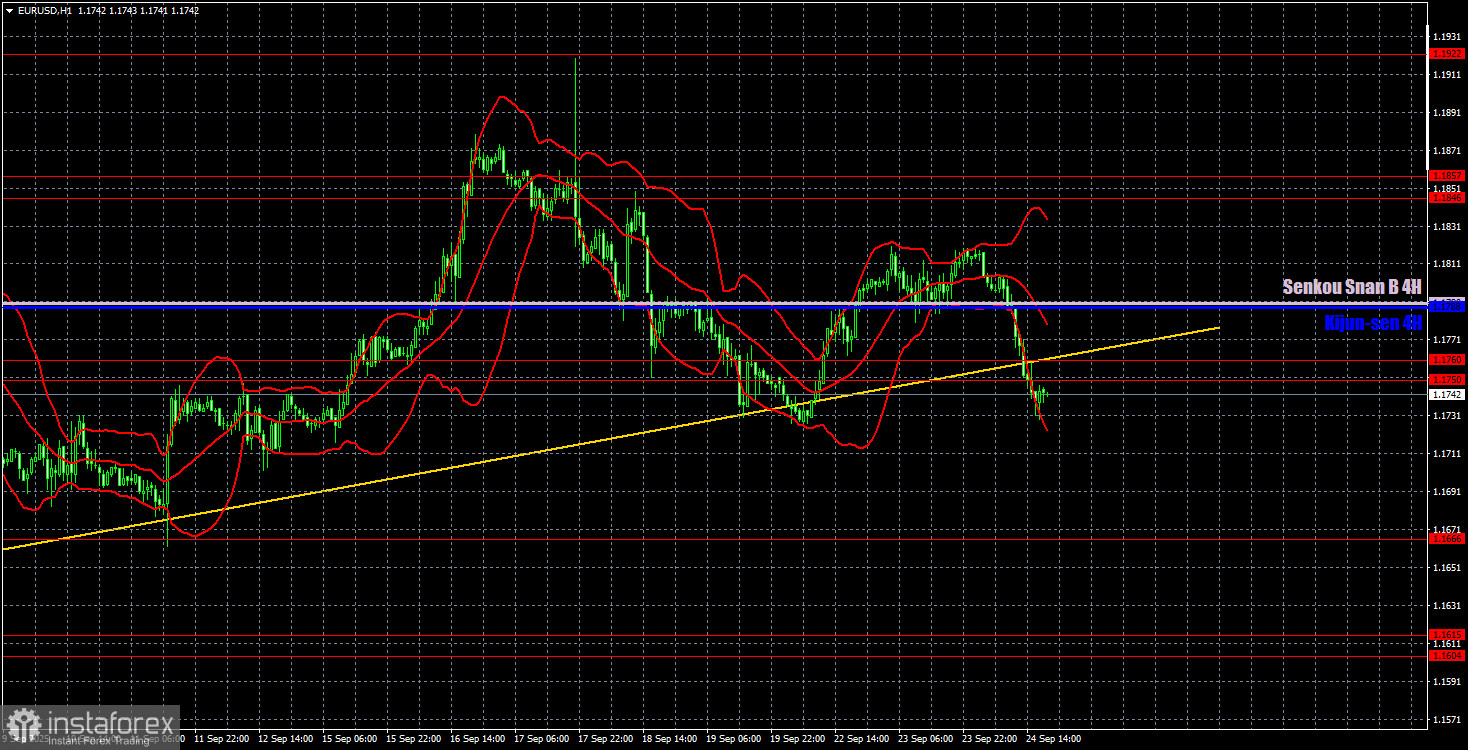
On the hourly timeframe, EUR/USD has invalidated the uptrend. In recent days, the price has been correcting, and it looks like this correction will continue. There were no significant reasons for the euro to fall. Initially, the GBP pulled the euro down, but now the market is selling it for unclear reasons. Of course, technical corrections are always possible. Perhaps the time for a new, prolonged dollar drop hasn't arrived yet.
For September 25, key trading levels are: 1.1234, 1.1274, 1.1362, 1.1426, 1.1534, 1.1604–1.1615, 1.1666, 1.1750–1.1760, 1.1846–1.1857, 1.1922, 1.1971–1.1988, and the Senkou Span B (1.1790) and Kijun-sen (1.1823) lines. The Ichimoku indicator lines may shift during the day; take this into account when determining trading signals. Don't forget to move your Stop Loss to break-even if the price moves in your favor by 15 pips; this will protect you from losses if the signal turns out to be false.
There are no noteworthy events or releases scheduled in the Eurozone on Thursday, while the US will publish important data on durable goods orders and the third estimate of Q2 GDP. This means traders will have something to react to during the second half of the day.
On Thursday, the pair may continue to decline since the ascending trendline has been broken. However, remember that the euro has no clear reasons to fall, and it is common for prices to reverse after breaking a trendline, hinting at a false breakout. Also, today's US macroeconomic data will play a crucial role.


