Voir aussi
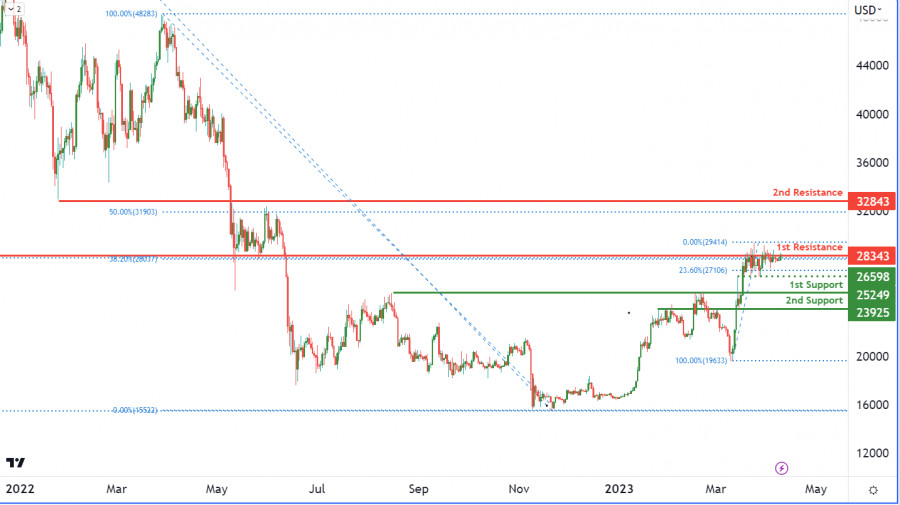
The BTC/USD chart currently reflects a bearish momentum in the cryptocurrency market, and Bitcoin seems to be following the trend. The chart suggests that the price of Bitcoin could face resistance at the 1st resistance level of 28343, which has previously been an important level as an overlap resistance. If Bitcoin fails to break through this level, it may result in a bearish reaction causing the price to drop towards the 1st support level of 25249. This level, being a pullback support, could act as a strong support for the price of Bitcoin.
In the event that the price of Bitcoin breaks through the 1st resistance level, the next resistance level it could face is the 2nd resistance level of 32843, which is a pullback resistance. Conversely, if Bitcoin breaks below the 1st support level, the next support level it could drop to is the 2nd support level of 23925. This level, also being a pullback support, could potentially act as a strong support for the price of Bitcoin.
Additionally, there is an intermediate support level at 26598, which is a swing low support and is accompanied by a 23.60% Fibonacci retracement. This level could potentially provide support to the price of Bitcoin if it drops towards the 1st support level. Overall, the BTC/USD chart's momentum is bearish, indicating that the price is expected to continue falling in the near term.
You have already liked this post today
*The market analysis posted here is meant to increase your awareness, but not to give instructions to make a trade.
Si nous examinons le graphique journalier de l'instrument de la marchandise Pétrole Brut, il semble y avoir une divergence entre le mouvement des prix du #CL et l'indicateur Oscillateur Stochastique
Sur le graphique de 4 heures de l'indice Nasdaq 100, on observe une divergence entre le mouvement de son prix et l'indicateur Stochastic Oscillator, notamment avec la confirmation actuelle
Si le cours de l'euro descend en dessous de 1.1500 dans les heures à venir, cela pourrait être vu comme une opportunité de vente. Techniquement, il semble suracheté
La tendance XAU/USD reste haussière tant que le prix se consolide au-dessus de 3,331. Par conséquent, il serait judicieux d'acheter de l'or tant que le prix se consolide au-dessus
Aujourd'hui, l'attention principale du marché sera tournée vers la publication du rapport sur l'inflation aux États-Unis, qui devrait non seulement montrer une pause dans la récente baisse mais également enregistrer
Your IP address shows that you are currently located in the USA. If you are a resident of the United States, you are prohibited from using the services of InstaFintech Group including online trading, online transfers, deposit/withdrawal of funds, etc.
If you think you are seeing this message by mistake and your location is not the US, kindly proceed to the website. Otherwise, you must leave the website in order to comply with government restrictions.
Why does your IP address show your location as the USA?
Please confirm whether you are a US resident or not by clicking the relevant button below. If you choose the wrong option, being a US resident, you will not be able to open an account with InstaTrade anyway.
We are sorry for any inconvenience caused by this message.