यह भी देखें

 15.07.2025 07:39 PM
Trade Analysis and Recommendations for the Japanese Yen
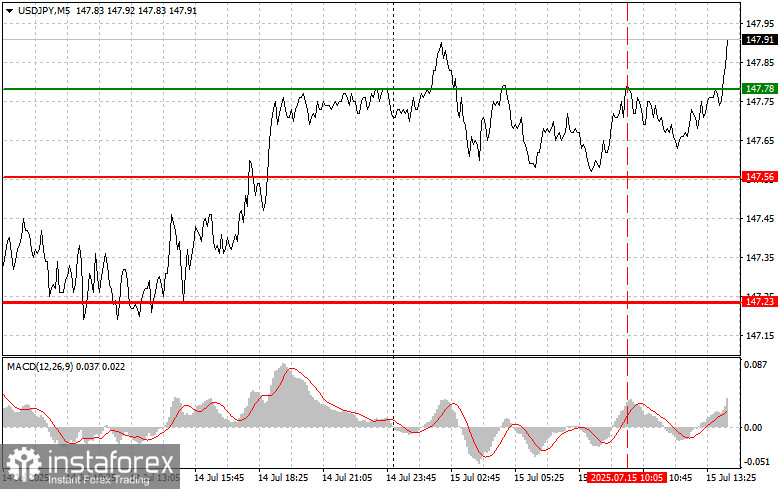
The price test at 147.78 occurred when the MACD indicator had already moved significantly above the zero line, which limited the pair's upward potential.
The June U.S. inflation figures — namely the overall Consumer Price Index and the Core CPI excluding food and energy — will be the key factor shaping the future dynamics of the USD/JPY currency pair. These are not just routine statistics, but essential benchmarks for the Federal Reserve and, consequently, for the yen's exchange rate against the U.S. dollar. If CPI exceeds expectations, the dollar will likely strengthen. Conversely, if inflation falls short of forecasts, the Fed may take a more cautious approach, weakening the dollar.
Today, traders will also closely monitor speeches by FOMC members Michelle Bowman and Michael S. Barr. Their remarks regarding the current economic outlook, inflation, and the Fed's future monetary policy could spark renewed dollar strength and a decline in the Japanese yen. Additionally, the Empire State Manufacturing Index will be released. This indicator reflects the health of the manufacturing sector in New York State and is a relevant signal of broader U.S. economic activity. Positive readings suggest expansion; negative ones, contraction. However, inflation will remain the primary focus of the day.
As for the intraday strategy, I will mainly rely on implementing Scenarios #1 and #2.
Buy Signal
Scenario #1: Today, I plan to buy USD/JPY at the 147.94 entry point (green line on the chart), targeting growth to 148.44 (thicker green line on the chart). Around 148.44, I will exit long positions and open short positions in the opposite direction, aiming for a 30–35 point move from that level. A solid rise in the pair can be expected if the uptrend continues. Important! Before buying, make sure the MACD indicator is above the zero line and just starting to rise.
Scenario #2: I also plan to buy USD/JPY if the price tests the 147.64 level twice consecutively, while the MACD is in the oversold zone. This would limit the pair's downward potential and prompt a market reversal upward. A move toward the opposite levels of 147.94 and 148.44 is likely.
Sell Signal
Scenario #1: I plan to sell USD/JPY after the price breaks below 147.64 (red line on the chart), which would lead to a sharp decline. The key target for sellers will be 147.16, where I plan to exit short positions and immediately open long positions in the opposite direction, aiming for a 20–25 point move from that level. Downward pressure on the pair may return if U.S. price data drops sharply. Important! Before selling, make sure the MACD indicator is below the zero line and just starting to fall.
Scenario #2: I also plan to sell USD/JPY if the price tests 147.94 twice consecutively while the MACD is in the overbought zone. This would limit the pair's upward potential and trigger a reversal to the downside. A decline toward the opposite levels of 147.64 and 147.16 is likely.
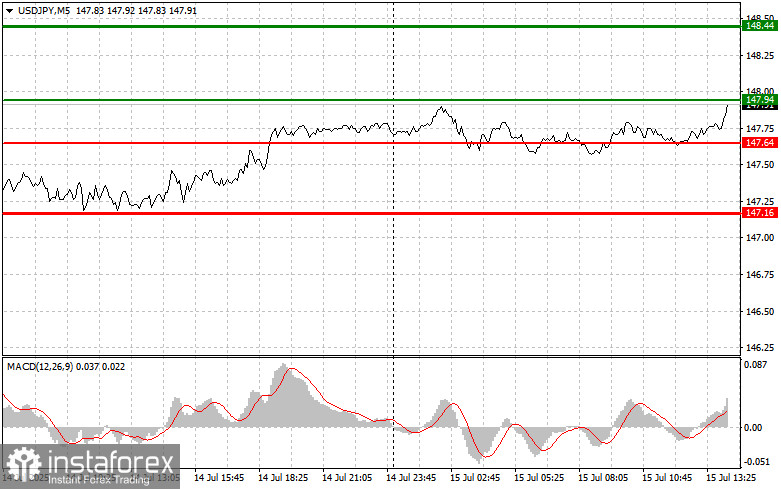
What's on the chart:
Important:Beginner traders in the Forex market should make entry decisions with great caution. It is best to stay out of the market before the release of major fundamental reports to avoid getting caught in sharp price swings. If you choose to trade during news events, always use stop-loss orders to minimize losses. Trading without stop-losses can quickly wipe out your entire deposit, especially if you trade large volumes without applying money management principles.
And remember: successful trading requires a clear plan — like the one outlined above. Spontaneous decision-making based on current market conditions is a losing strategy for intraday traders.

