यह भी देखें

 16.07.2025 04:22 AM
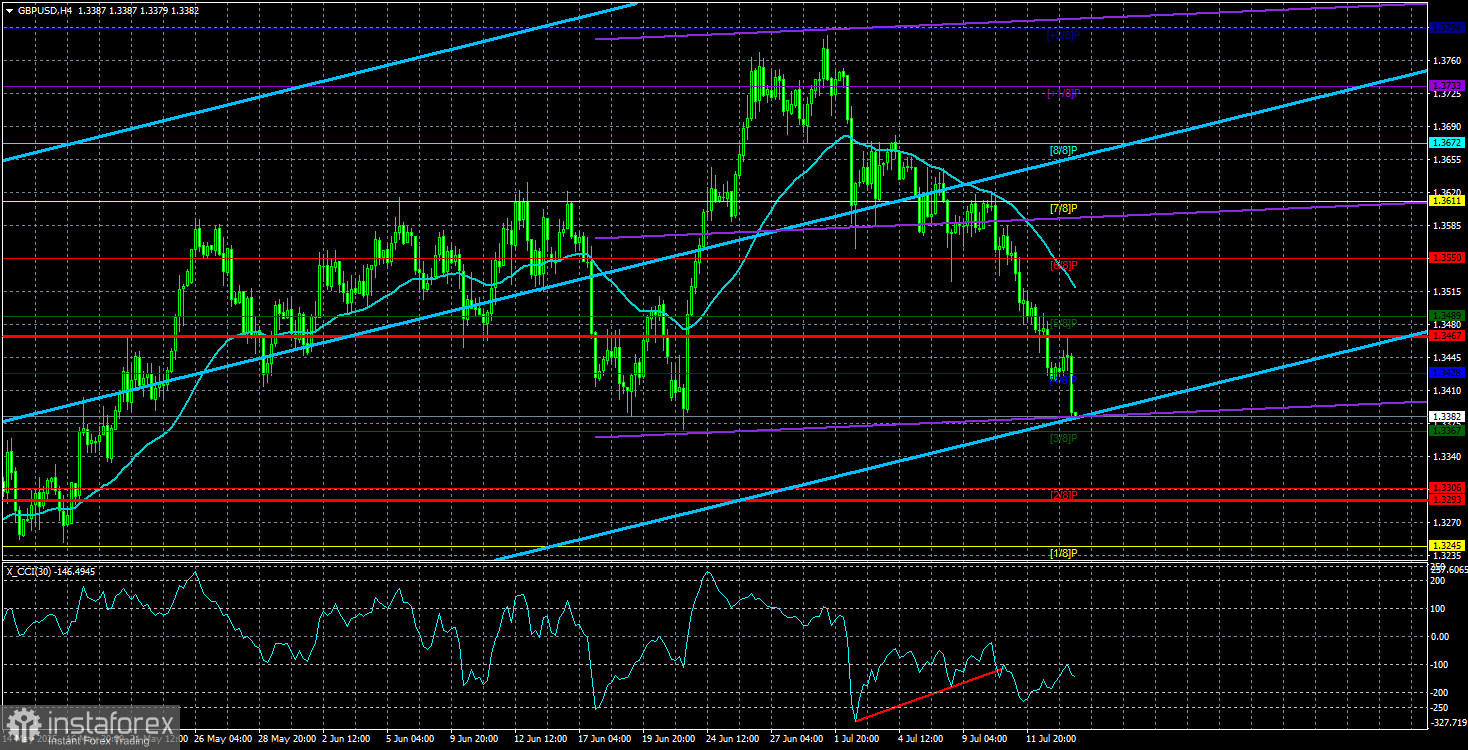
The GBP/USD currency pair has been in a downtrend for the past few weeks, raising some questions. Yes, if we switch to the daily (24-hour) timeframe, the current strong downward move appears more like a relatively mild correction—we've seen several of those over the past six months. Nonetheless, while the euro is barely declining, the British pound is falling quite actively. A divergence has emerged between the two major currency pairs.
We believe that a purely technical correction is currently taking place in both pairs. Yes, the British pound is declining more steeply than the euro, but it also rose more strongly over the past six months. Most importantly, there are currently no significant reasons in the UK for the pound's decline that would interest the market. If the market wanted to sell the pound, it could have done so during the two monetary policy easings by the Bank of England in 2025, for example. Right now, the market remains focused solely on Donald Trump's tariff war. If that's the case, then there's no compelling reason to buy the dollar either.
Of course, we must never forget that we are dealing with a massive market where large players make decisions based not only on fundamentals and macroeconomics. As we've mentioned before, a major commercial bank might carry out a large foreign exchange transaction to purchase dollars simply because it needs U.S. currency at that time for its operations. The forex market is not composed solely of speculators trying to profit from price differences. Therefore, we cannot completely rule out the possibility of further GBP/USD declines either.
Meanwhile, macroeconomic data from China have been released. It turns out that in the second quarter, neither export volumes nor GDP growth slowed; they exceeded forecasted figures. Recall that it was in the second quarter that Trump imposed "draconian" tariffs on imports from China. As we can see, Chinese businesses quickly reoriented toward other countries, found various ways to maintain exports to the U.S. via third countries, and suffered virtually no losses. Thus, Trump's tariffs—which, let's remember, will be paid not by the Chinese but by Americans—are so far only backfiring on the U.S. itself.
What's important here is understanding what is meant by "America." If we're talking about government revenue, then for the first time in eight years, the federal budget showed a monthly surplus. And this is solely thanks to Trump's tariffs. But with equal success, Trump could have raised taxes and achieved a surplus that way too. He could have introduced a new "American payment" aimed at "restoring Great America." Either way, the American nation—not China or the European Union—is footing the bill for Trump's victories. Trump is simply collecting money from American consumers, but instead of calling it "taxes," it's now labeled "tariffs." That's the only difference. Meanwhile, China continues to thrive—with or without tariffs—because its economy doesn't depend solely on the United States.
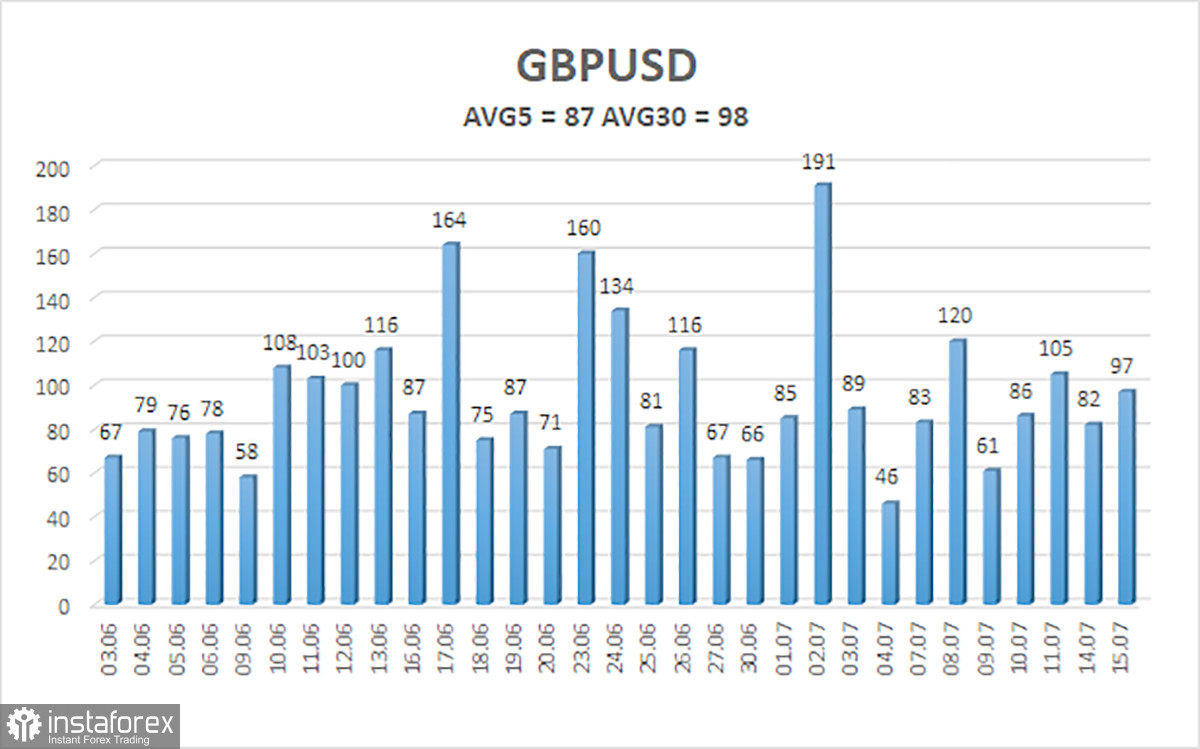
The average volatility of the GBP/USD pair over the past five trading days is 87 pips, which is considered "moderate" for this pair. On Wednesday, July 16, we therefore expect movement within a range defined by 1.3293 to 1.3467. The long-term regression channel is pointing upward, which clearly indicates an uptrend. The CCI indicator has entered oversold territory twice, now signaling a possible resumption of the upward trend. Bullish divergences are also forming.
S1 – 1.3367
S2 – 1.3306
S3 – 1.3245
R1 – 1.3428
R2 – 1.3489
R3 – 1.3550
The GBP/USD currency pair continues its downward correction, which may come to an end soon. In the medium term, Trump's policies will likely continue to pressure the dollar. Thus, long positions targeting 1.3611 and 1.3672 remain relevant if the price secures a position above the moving average. If the price is below the moving average line, small short positions may be considered, with targets at 1.3306 and 1.3293, based solely on technical grounds. The U.S. dollar occasionally sees corrective gains, but for a sustained uptrend, the market needs clear signs that the global trade war is truly over.
Linear Regression Channels help determine the current trend. If both channels are aligned, it indicates a strong trend.
Moving Average Line (settings: 20,0, smoothed) defines the short-term trend and guides the trading direction.
Murray Levels act as target levels for movements and corrections.
Volatility Levels (red lines) represent the likely price range for the pair over the next 24 hours based on current volatility readings.
CCI Indicator: If it enters the oversold region (below -250) or overbought region (above +250), it signals an impending trend reversal in the opposite direction.

