Lihat juga

 27.06.2025 06:42 AM
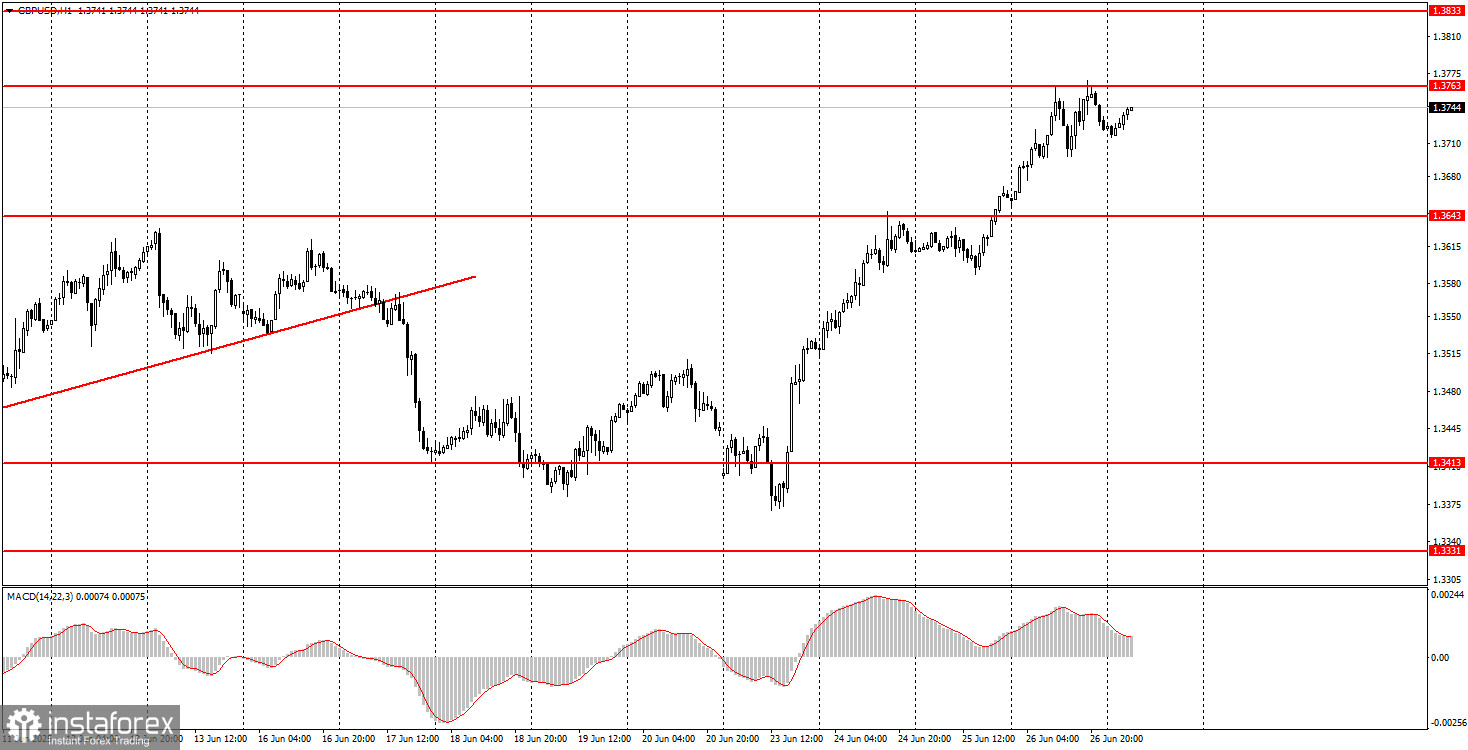
On Thursday, the GBP/USD pair also remained in an upward trend, and there was no shortage of significant developments across the Atlantic.
Firstly, Donald Trump resumed his attacks on the Federal Reserve, but out of desperation, he couldn't come up with anything better than announcing his readiness to select a new Fed chair. Powell's term ends in May of next year, but Trump is already eager to find a replacement. This makes little sense since a lot can happen in a year, but Powell irritates Trump so much that he wants, at least on paper, to replace him as soon as possible.
Secondly, the final estimate of Q1 GDP was released. After the second estimate, some traders believed that the tariff situation wasn't all that bad, as the economy had slowed by "only" 0.2% quarter-over-quarter. This is after three years of quarterly growth at a rate of 2–3%. However, the final GDP figure for Q1 came in at 0.5%. So even the report on durable goods orders, which posted an extremely high figure, failed to save the dollar from another decline.
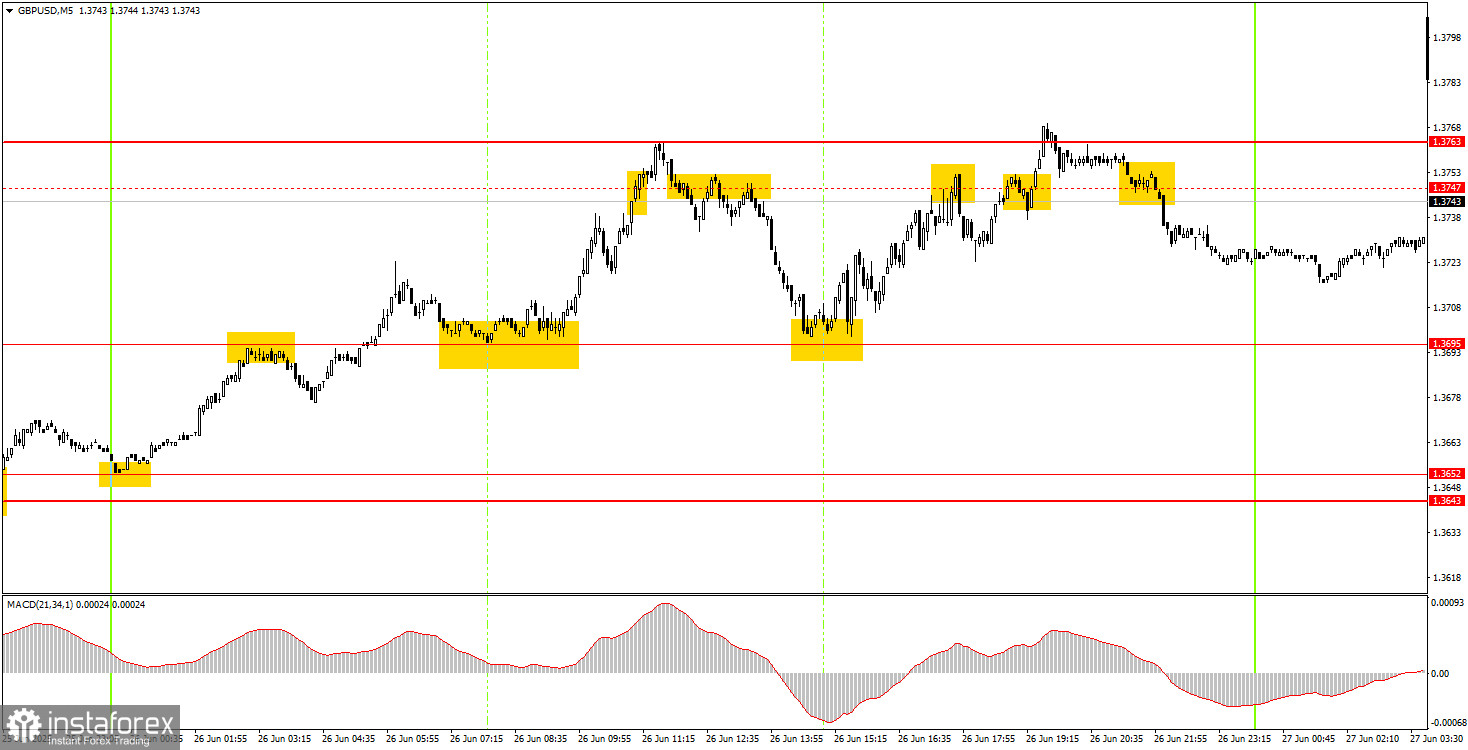
In the 5-minute timeframe, the pair generated a fair number of trading signals on Thursday. It's worth noting right away that the level of 1.3747 has been adjusted to 1.3763, as several levels had to be recalibrated due to being outdated after three years of inactivity.
Around the 1.3695 level, two solid buy signals were generated. In both cases, the price reached the nearest target level. Near 1.3747, buy signals pointed to trend continuation, while sell signals allowed for short positions. In the first case, the price also hit the target. Therefore, three out of four potential trades were profitable.
On the hourly timeframe, the GBP/USD pair continues to focus primarily on Trump and remains highly skeptical of his policies. The market is still either selling the dollar or waiting for new negative news from overseas to sell it again. This pattern will persist until the market sees real signs of an end to the trade war and until Trump stops making decisions he isn't authorized to make, decisions that make traders' hair stand on end.
On Friday, the GBP/USD may continue its upward movement as the market begins forming a new leg of the uptrend. As before, there are plenty of reasons for the market to stay away from the U.S. dollar.
On the 5-minute timeframe, you can currently trade using the following levels: 1.3203–1.3211, 1.3259, 1.3329–1.3331, 1.3413–1.3421, 1.3518–1.3535, 1.3580–1.3592, 1.3643–1.3652, 1.3695, 1.3763, 1.3814–1.3832. On Friday, no significant events are scheduled in the UK. Meanwhile, in the U.S., reports on personal income and spending, the PCE index, and the University of Michigan Consumer Sentiment Index are expected to be released.
Support and Resistance Levels: These are target levels for opening or closing positions and can also serve as points for placing Take Profit orders.
Red Lines: Channels or trendlines indicating the current trend and the preferred direction for trading.
MACD Indicator (14,22,3): A histogram and signal line used as a supplementary source of trading signals.
Important Events and Reports: Found in the economic calendar, these can heavily influence price movements. Exercise caution or exit the market during their release to avoid sharp reversals.
Forex trading beginners should remember that not every trade will be profitable. Developing a clear strategy and practicing proper money management are essential for long-term trading success.


