یہ بھی دیکھیں

 27.06.2025 11:39 AM
Trend Analysis (Fig. 1):
On Friday, from the 1.1699 level (yesterday's daily candle close), the market may continue rising toward the 1.1744 target level – the 161.8% Fibonacci projection (red dashed line). Upon testing this level, a price pullback may occur toward 1.1700 – the 14.6% retracement level (yellow dashed line).
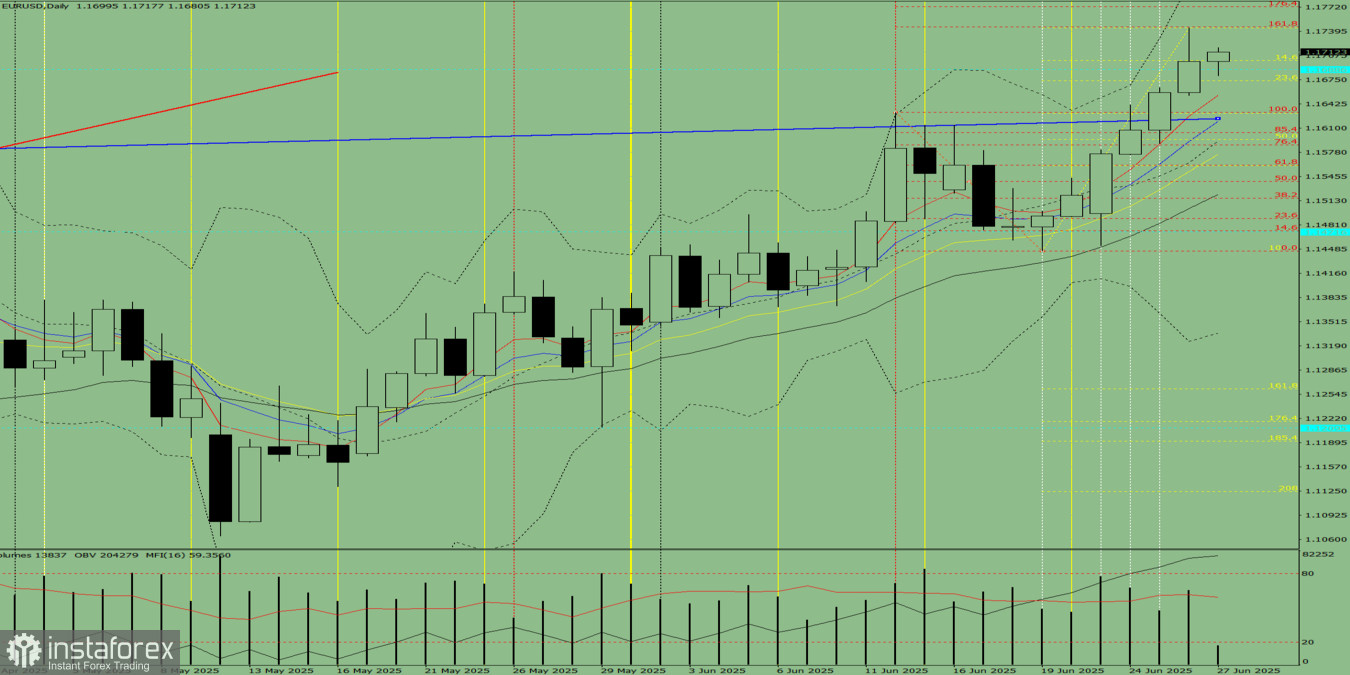
Fig. 1 (Daily Chart)
Comprehensive Analysis:
Overall conclusion: bullish trend
Alternative Scenario: Today, from the 1.1699 level (yesterday's daily candle close), the price may continue to rise toward the 1.1744 target level – 161.8% Fibonacci projection (red dashed line). If this level is tested, the upward movement may extend toward the 1.1772 target – 176.4% Fibonacci projection (red dashed line).
You have already liked this post today
*تعینات کیا مراد ہے مارکیٹ کے تجزیات یہاں ارسال کیے جاتے ہیں جس کا مقصد آپ کی بیداری بڑھانا ہے، لیکن تجارت کرنے کے لئے ہدایات دینا نہیں.


