Veja também

 27.06.2025 10:48 PM
Análise de tendências (Fig. 1):
Na sexta-feira, a partir do nível 1,1699 (fechamento da vela diária de ontem), o mercado pode continuar a subir em direção ao nível-alvo de 1,1744 - a projeção de Fibonacci de 161,8% (linha tracejada vermelha). Ao testar esse nível, um recuo de preço pode ocorrer em direção a 1,1700 - o nível de retração de 14,6% (linha tracejada amarela).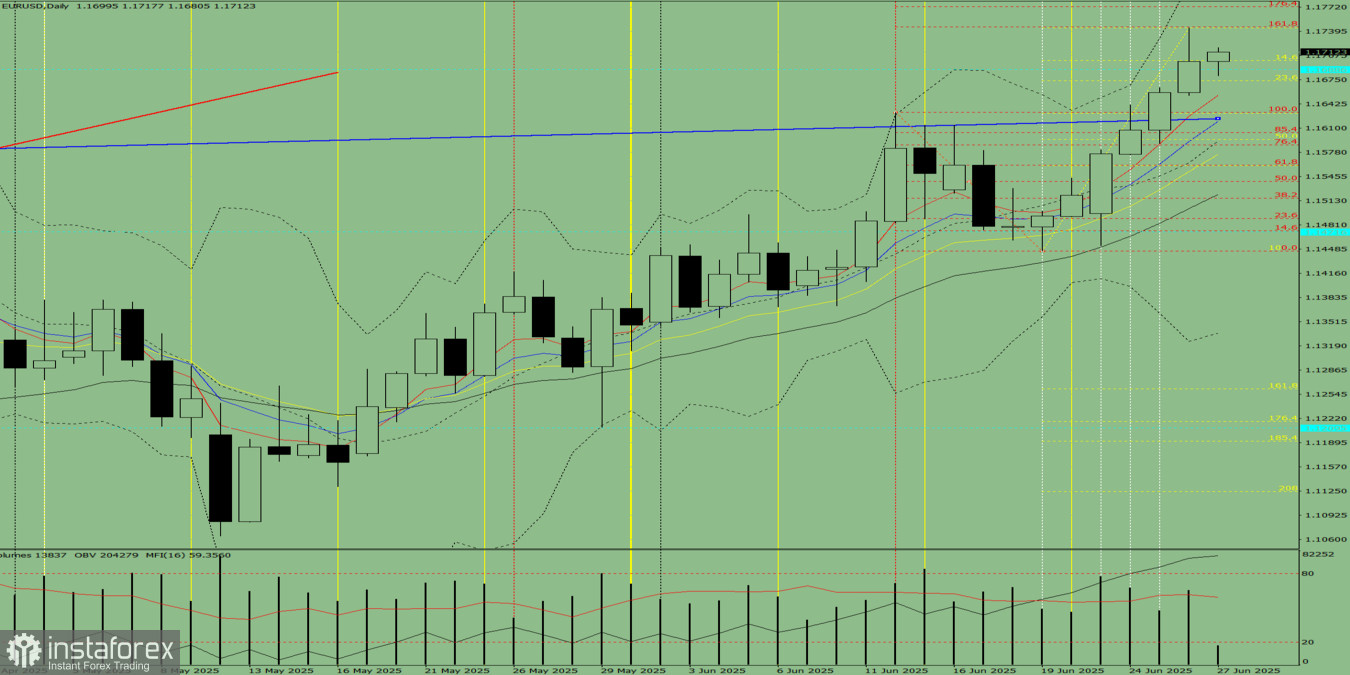
Fig. 1 (Gráfico Diário)
Análise geral:
Conclusão geral: tendência de alta
Cenário alternativo: Hoje, a partir do nível 1,1699 (fechamento da vela diária de ontem), o preço pode continuar subindo em direção ao nível-alvo 1,1744 – projeção de Fibonacci de 161,8% (linha tracejada vermelha). Se este nível for testado, o movimento de alta pode se estender em direção ao alvo 1,1772 – projeção de Fibonacci de 176,4% (linha tracejada vermelha).
You have already liked this post today
*A análise de mercado aqui postada destina-se a aumentar o seu conhecimento, mas não dar instruções para fazer uma negociação.


