یہ بھی دیکھیں

 28.07.2025 07:25 AM
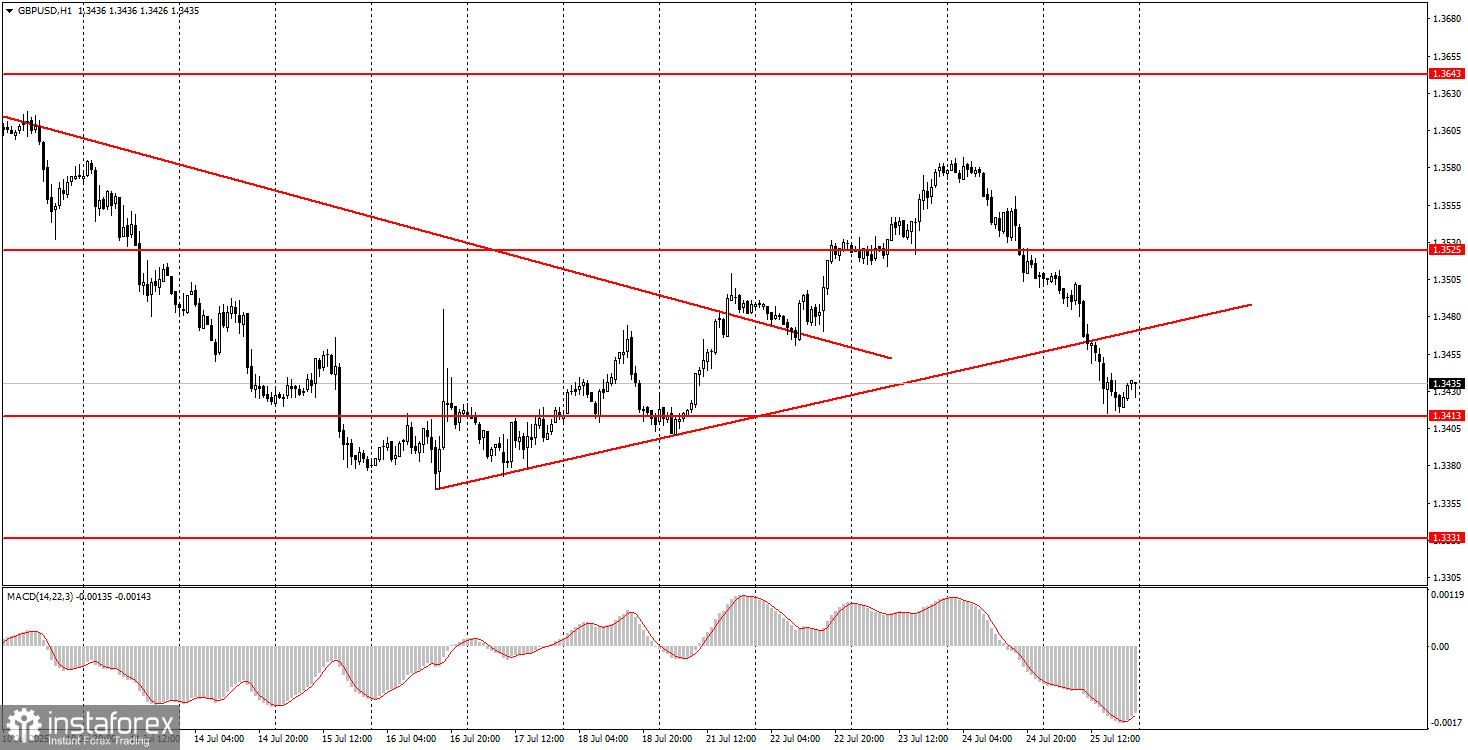
On Friday, the GBP/USD pair continued its decline, which began on Thursday. First, we would like to point out that the fall of the British pound was unlikely to have been triggered by macroeconomic data from the UK. Yes, the PMI indices in the services and manufacturing sectors, as well as the retail sales report, showed weak figures. However, were these three relatively unimportant reports enough for the pound to fall by 140 pips? Notably, the decline lasted for two consecutive days with virtually no interruptions. In other words, the market was persistently selling the pound.
We believe this movement again falls under the definition of a technical correction. On higher timeframes (daily and above), it is visible that the British currency has been rising for six consecutive months, with only rare and weak corrections. Therefore, it may now be time for a more significant correction. There are no other explanations, given the unchanged fundamental backdrop. It is also worth mentioning the disappointing U.S. durable goods orders report released on Friday. Despite the result being slightly better than forecast, it certainly cannot be described as "optimistic."

In the 5-minute timeframe, three trading signals were formed on Friday. The first one was formed during the night—we noted it, but it was difficult to act on it. Then, during the day, the price steadily declined, broke through the 1.3466 level, and by the end of the day reached the 1.3413–1.3421 zone, which it failed to break. As a result, even the sell signal near the 1.3466 level ultimately proved profitable.
On the hourly timeframe, the GBP/USD pair shows that the downward technical correction may not be over yet. Without any significant reason, the pound declined for two straight days and broke through the ascending trendline. Therefore, the dollar may continue to recover slightly in the near term, and the scale of the correction is best determined using the daily timeframe.
On Monday, the GBP/USD pair may rebound slightly upward, as it bounced off the 1.3413–1.3421 zone four times on Friday. Formally, this is a buy signal, and it can be traded with a target of 1.3466. A break below the 1.3413–1.3421 area would allow novice traders to open short positions targeting 1.3329–1.3331.
On the 5-minute timeframe, trading can be based on the following levels: 1.3203–1.3211, 1.3259, 1.3329–1.3331, 1.3413–1.3421, 1.3466, 1.3518–1.3532, 1.3574–1.3590, 1.3643–1.3652, 1.3682, 1.3763, 1.3814–1.3832.
For Monday, there are no important events or reports scheduled in either the U.S. or the Eurozone.
Support and Resistance Levels: These are target levels for opening or closing positions and can also serve as points for placing Take Profit orders.
Red Lines: Channels or trendlines indicating the current trend and the preferred direction for trading.
MACD Indicator (14,22,3): A histogram and signal line used as a supplementary source of trading signals.
Important Events and Reports: Found in the economic calendar, these can heavily influence price movements. Exercise caution or exit the market during their release to avoid sharp reversals.
Forex trading beginners should remember that not every trade will be profitable. Developing a clear strategy and practicing proper money management are essential for long-term trading success.


