یہ بھی دیکھیں

 14.08.2025 06:49 AM
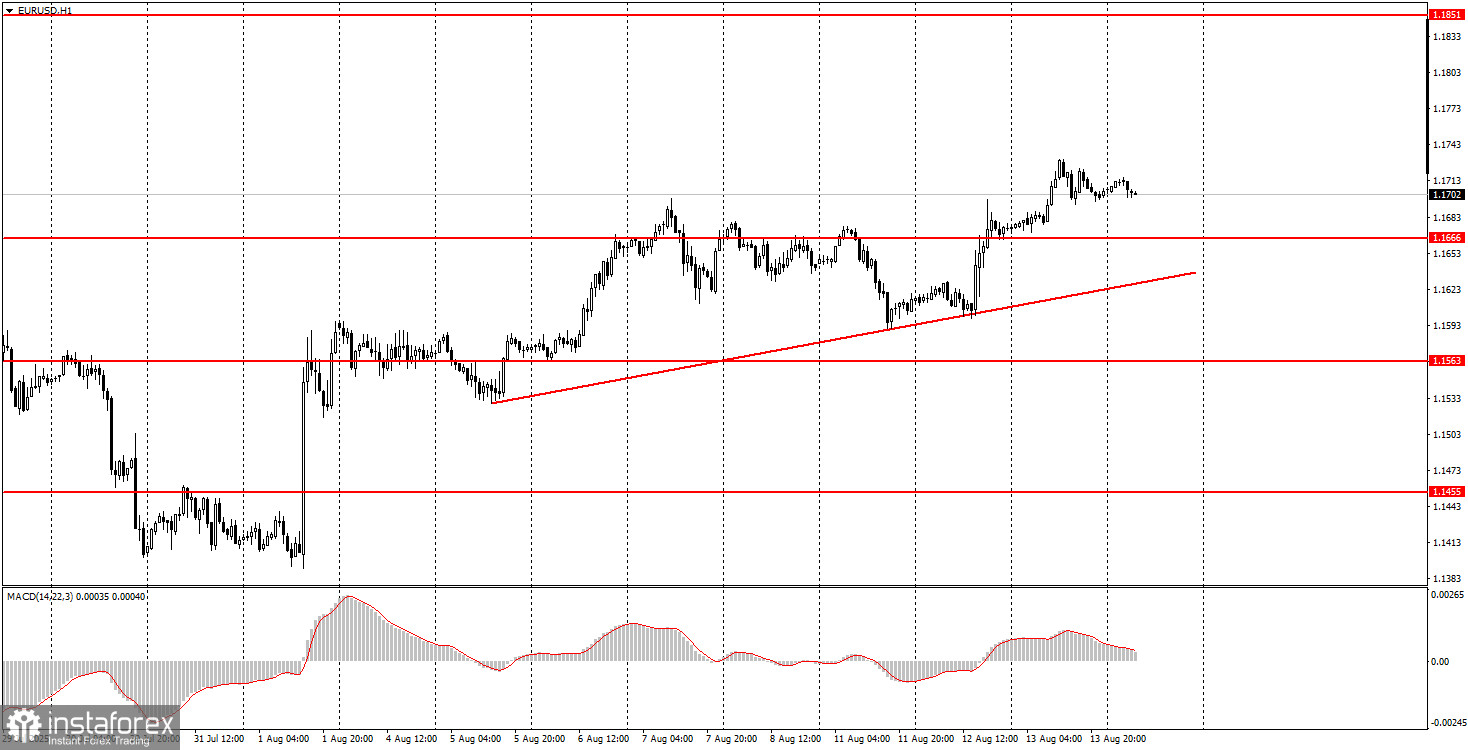
On Wednesday, the EUR/USD currency pair continued its upward movement. It was not a strong rise, but it was upward, in line with the current bullish trend. As we have already noted, the dollar currently does not need any fresh local triggers to keep falling. Yesterday, there were no reports, no important events, and no speeches. Nevertheless, the US currency continued to decline, as it is under significant pressure from the global fundamental background. For example, this week alone, the probability of a Federal Reserve key rate cut — not only in September but at every meeting until the end of the year — has increased significantly. This was driven by the US inflation report, which showed that prices are rising very slowly, and Trump's tariff wars are having almost no effect on pricing. It sounds like an economic paradox: the prices of imported goods are rising, yet overall prices are barely increasing. However, this paradox works. If inflation is not growing, the Fed has no reason not to cut the key rate. And the dollar was falling sharply even when the Fed kept rates at nearly their peak levels.
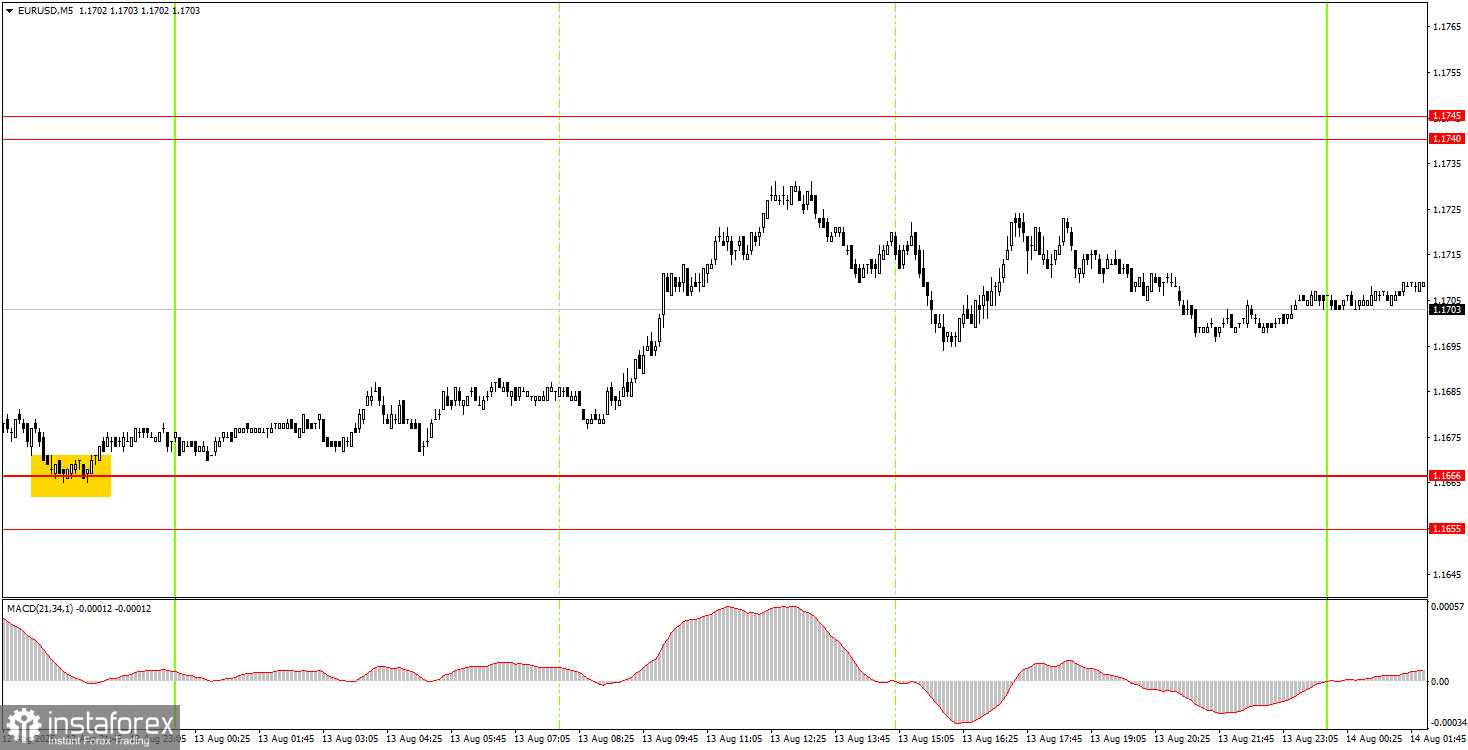
On the 5-minute timeframe on Wednesday, no trading signals were formed. The price bounced from the 1.1666 level during the night on Tuesday, and although this was technically a signal, it was difficult to trade. Nevertheless, it triggered a new upward leg in the pair. In the near term, we expect a rise toward the 1.1740–1.1750 area.
On the hourly timeframe, the EUR/USD pair has every chance to continue the uptrend that has been developing since the start of this year. The "house of cards" for the US dollar collapsed on Friday of the week before last, and since then, the situation for the dollar has continued to deteriorate. The Fed may soon resume its monetary policy easing cycle, and a de-escalation of the military conflict between Ukraine and Russia could increase demand for risk-sensitive currencies rather than the dollar.
On Thursday, the EUR/USD pair may continue its upward movement, as it has broken through the 1.1655–1.1666 area and has twice bounced off it from above. Therefore, long positions will remain relevant today. Short positions can be considered, for example, if the price bounces from the 1.1740–1.1750 area.
On the 5-minute timeframe, the levels to consider are: 1.1198–1.1218, 1.1267–1.1292, 1.1354–1.1363, 1.1413, 1.1455–1.1474, 1.1527, 1.1552–1.1563–1.1571, 1.1655–1.1666, 1.1740–1.1745, 1.1808, 1.1851, 1.1908. On Thursday, the eurozone is scheduled to release GDP and industrial production figures. In the US, producer price index data and jobless claims will be published. These are not the most important indicators and may only trigger a minor reaction from traders.
Support and Resistance Levels: These are target levels for opening or closing positions and can also serve as points for placing Take Profit orders.
Red Lines: Channels or trendlines indicating the current trend and the preferred direction for trading.
MACD Indicator (14,22,3): A histogram and signal line used as a supplementary source of trading signals.
Important Events and Reports: Found in the economic calendar, these can heavily influence price movements. Exercise caution or exit the market during their release to avoid sharp reversals.
Forex trading beginners should remember that not every trade will be profitable. Developing a clear strategy and practicing proper money management are essential for long-term trading success.


