یہ بھی دیکھیں

 09.09.2025 10:51 AM
On Monday, the EUR/USD pair reversed in favor of the euro and resumed growth toward the resistance zone at 1.1789–1.1802, which is now very close. Unfortunately, a rebound from the 76.4% Fibonacci level at 1.1695 did not occur yesterday, which could have given traders an opportunity to open new long positions. Today, a rebound from the 1.1789–1.1802 level will work in favor of the U.S. dollar and a pullback toward 1.1695. A breakout above 1.1789–1.1802 will increase the likelihood of further growth toward the next Fibonacci level at 127.2% – 1.1896.
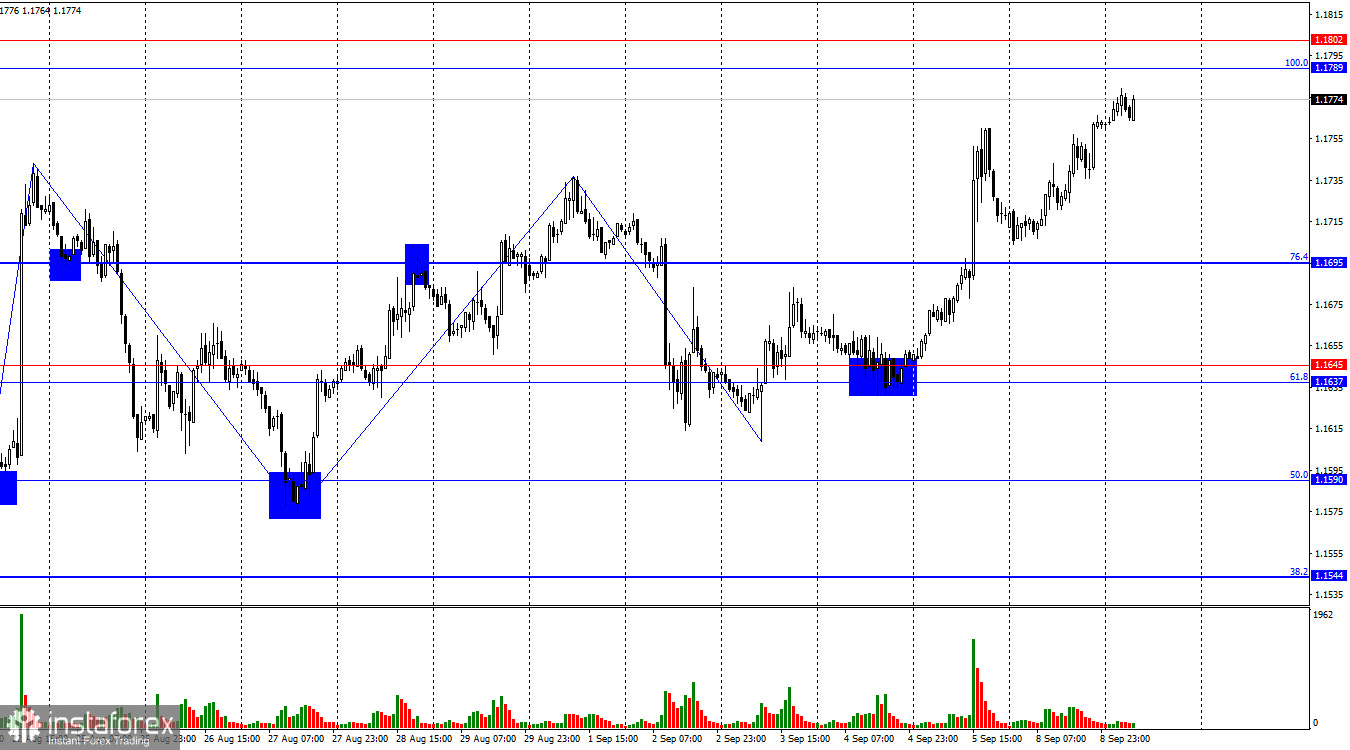
The wave structure on the hourly chart remains simple and clear. The last completed downward wave did not break the previous low, while the last upward wave broke the previous peak. Thus, the trend is shifting to "bullish." The latest labor market data and the changed outlook for Fed monetary policy are supporting bullish traders.
On Monday, there were few economic events, and they were certainly not the reason for the euro's rise. Germany released reports on the trade balance and industrial production, which did not particularly interest traders. The same can be said about the emerging political crisis in France. Members of the French Parliament are preparing to issue a vote of no confidence in Prime Minister Francois Bayrou after he presented his 2026 budget proposals. Bayrou suggested reducing the deficit through higher taxes, freezing pensions and social benefits, cutting healthcare spending, and reducing public holidays. The proposal was poorly received, and Bayrou will most likely resign, leaving President Emmanuel Macron to either appoint a new prime minister or call early parliamentary elections. However, traders showed no reaction to these developments, signaling a lack of interest in political news from France. For traders, U.S.-related economic factors remain the priority.
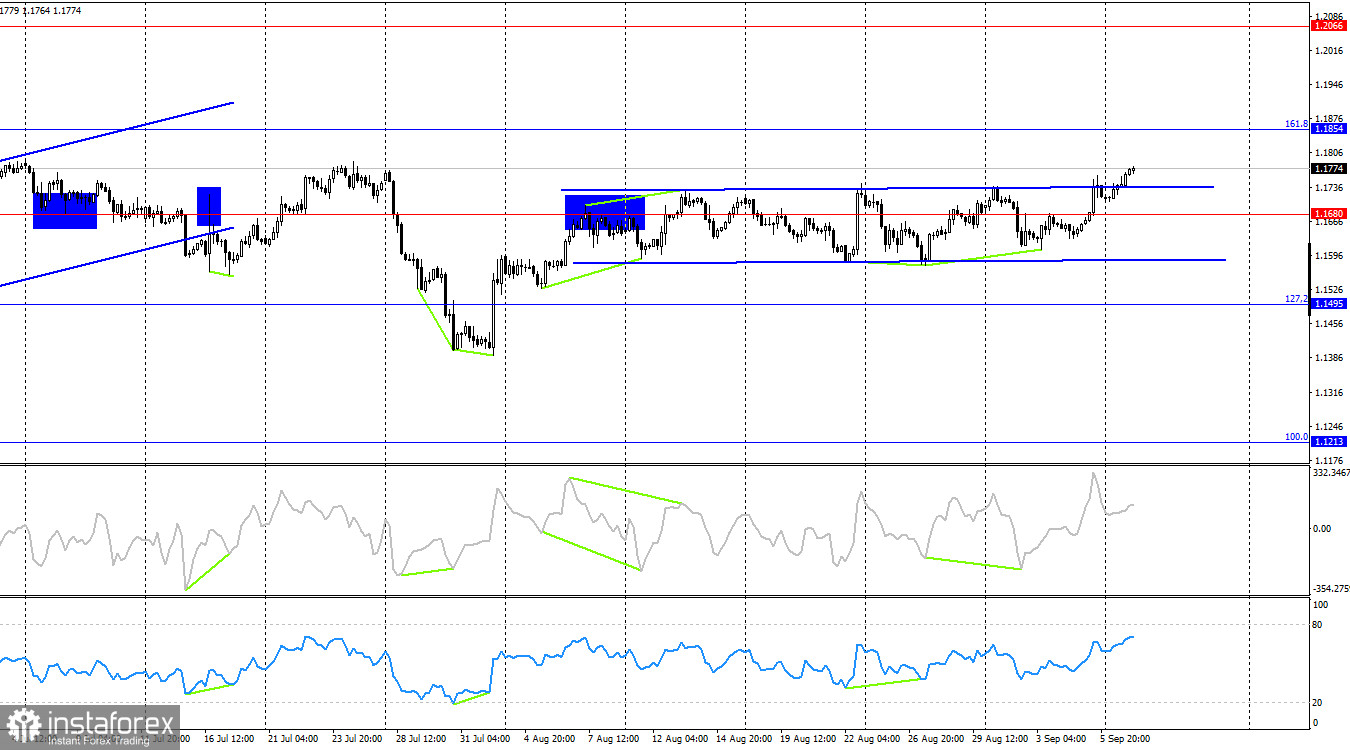
On the 4-hour chart, the pair consolidated above the horizontal range, allowing traders to count on further growth toward the 161.8% corrective level at 1.1854. No impending divergences are seen on any indicator today. A rebound from 1.1854 will work in favor of the dollar and a pullback, while a breakout above this level will increase the pair's chances of continuing upward toward the next target at 1.2066.
Commitments of Traders (COT) report:
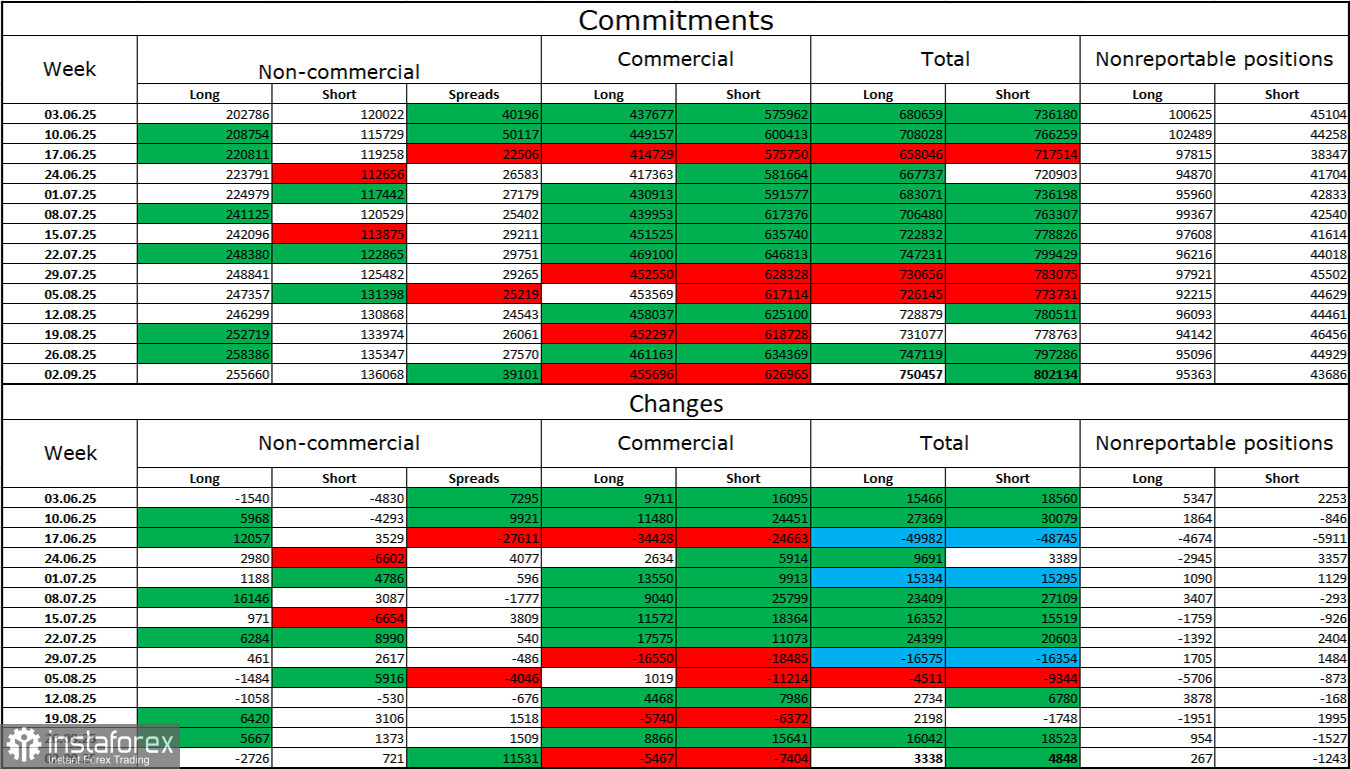
Over the last reporting week, professional traders closed 2,726 long positions and opened 751 short positions. The sentiment of the "Non-commercial" group remains bullish thanks to Donald Trump and has been strengthening over time. The total number of long positions held by speculators now stands at 255,000, while short positions number 136,000 — nearly a twofold difference. Note also the number of green cells in the table above, showing strong accumulation of euro positions. In most cases, interest in the euro is rising, while interest in the dollar is falling.
For thirty consecutive weeks, large players have been reducing shorts and increasing longs. Trump's policies remain the dominant factor for traders, as they may trigger problems with long-term and structural implications for the U.S. economy. Despite the signing of several important trade deals, some key economic indicators continue to decline.
News calendar for the U.S. and EU:
U.S. – Adjustment of annual Nonfarm Payrolls (14:00 UTC).
On September 9, the economic calendar contains just one entry, but an important one! Its impact on market sentiment may be very strong in the second half of the day.
EUR/USD forecast and trading tips:
Sales can be considered today after a rebound from 1.1789–1.1802 on the hourly chart, with a target at 1.1695. Buying the pair was possible after a rebound from 1.1637–1.1645 with a target at 1.1695, which has already been reached. A close above 1.1695 allows traders to keep positions open with a target at 1.1789, which is nearly achieved. New buys can be considered after a close above 1.1789–1.1802, with a target at 1.1896.
Fibonacci grids are built from 1.1789–1.1392 on the hourly chart and from 1.1214–1.0179 on the 4-hour chart.


