یہ بھی دیکھیں

 22.09.2025 07:24 AM
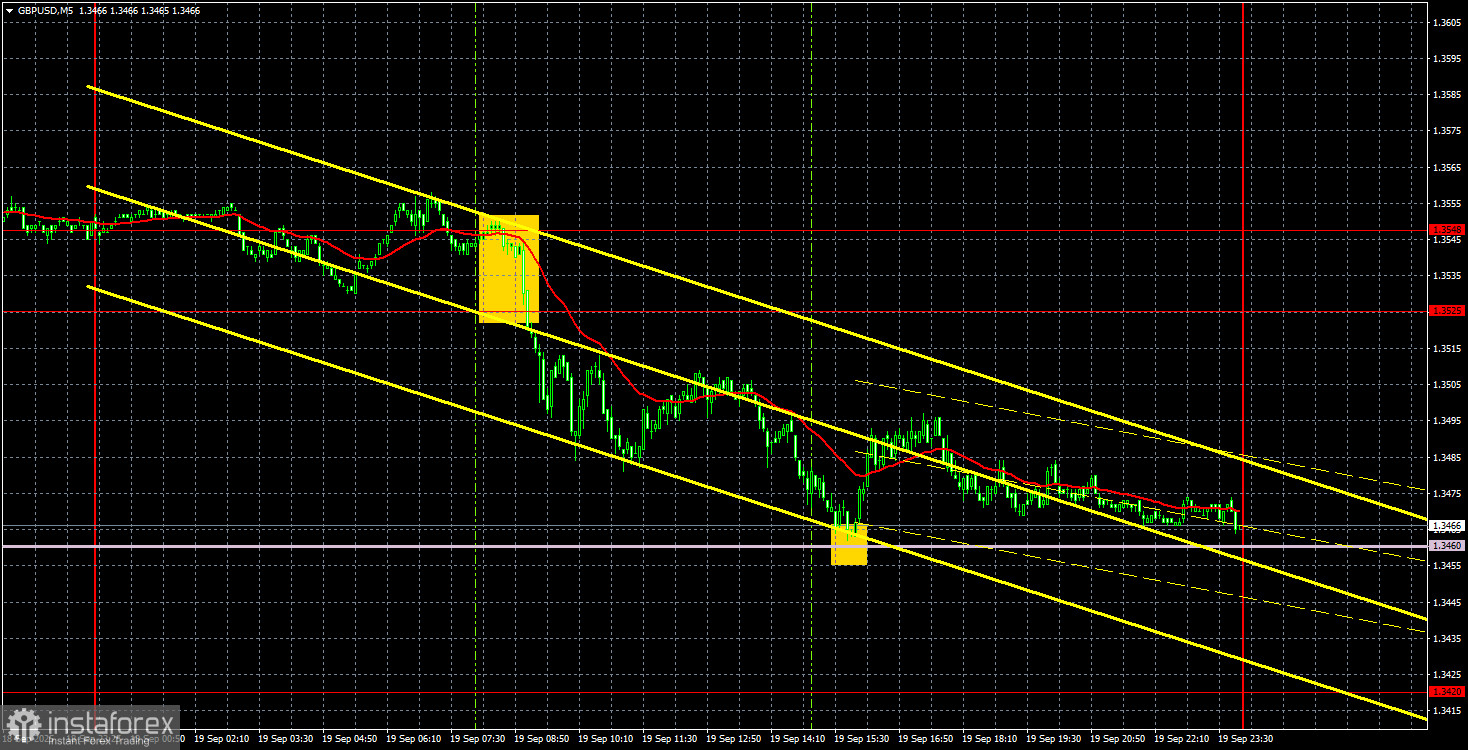
The GBP/USD currency pair continued its downward movement on Thursday and Friday, having earlier broken through the ascending trend line. From a technical perspective, the decline of the British pound was fairly easy to predict. As mentioned before, the trend line was breached—an important signal of movement against the prevailing trend. However, last week unfolded in a highly pessimistic scenario for the pound. Most of the macroeconomic data from the UK was moderately positive. The Federal Reserve meeting can be considered dovish, and the Bank of England meeting was neutral. Despite that, the pound showed a strong decline over the past three weeks due to renewed budget issues in the UK.
Technically, the price has approached the Senkou Span B line, which serves as the last support level for the British currency. A rebound from this line could trigger a resumption of the uptrend on all timeframes. It's important to understand that a budget deficit is serious, but, for example, in the U.S., a budget deficit is a common occurrence that has persisted for years—and yet this has not stopped the U.S. dollar from gaining against its European counterparts over the past 16–17 years. The budget issue may have already been priced in by the market.
On the 5-minute chart, a sell signal was formed in the first hour of the European trading session on Friday. The price confidently broke through the 1.3525–1.3548 level, allowing traders to open short positions. During the early U.S. session, the Senkou Span B line was tested, and traders could have either taken profit on their short positions or opened long positions. Although upward movement did not materialize, the second trade was not a loss—the price moved up the required 20 points.
COT Report
The COT (Commitment of Traders) reports on the British pound show that commercial traders' sentiment has been constantly shifting in recent years. The red and blue lines, representing the net positions of commercial and non-commercial traders, continually cross over and are generally near the zero mark. At present, they are still at almost the same level, indicating an approximate balance between long and short positions.
The dollar continues to decline due to Donald Trump's policies, so demand among market makers for the pound is not especially high right now. The trade war is likely to persist in one form or another for quite some time. The Federal Reserve is expected to cut interest rates within the next year. As a result, demand for the dollar will likely continue to fall. According to the latest COT report on the British pound, the "Non-commercial" group opened 5.9K buy positions and closed 21.1K sell positions. Thus, the net position of non-commercial traders increased by 27K over the week.
In 2025, the pound rose significantly, but the reason for this rally was singular—Donald Trump's policies. Once this factor diminishes or is neutralized, the dollar may resume its growth. However, when this might occur is unknown to anyone. The speed at which the pound's net position is growing or shrinking doesn't really matter; it's the dollar's net position that continues to decrease and typically at a faster pace.
GBP/USD 1-Hour Analysis
On the hourly timeframe, the GBP/USD pair pulled back last week due to negative fundamental factors. It's fair to say that a new downward trend has begun. The Senkou Span B line may help the British currency stay afloat, but its breach would open the door to further downside. The dollar still lacks strong global reasons to strengthen, but technical factors shouldn't be ignored.
Key levels for September 22: 1.3125, 1.3212, 1.3369–1.3377, 1.3420, 1.3533–1.3548, 1.3584, 1.3681, 1.3763, 1.3833, 1.3886. The Senkou Span B line (1.3460) and the Kijun-sen (1.3581) can also generate signals. A recommended Stop Loss can be set to breakeven once the price moves 20 points in the intended direction. Keep in mind that the Ichimoku indicator lines may shift throughout the day, which should be considered when determining trade signals.
On Monday, speeches are scheduled in the UK by Bank of England Governor Andrew Bailey and Chief Economist Huw Pill. Considering the recent budget and government debt issues, both officials may address the topic. In general, both Pill and Bailey speak relatively rarely, and their speeches usually attract significant market attention.
Trade Recommendations:
On Monday, traders can consider trading off the Senkou Span B line. A rebound from this level would allow for opening long positions with a target at 1.3533–1.3548, while a break below it opens the way for shorts with targets at 1.3420 and 1.3377.
Legend for the illustrations:


