Veja também


 15.05.2025 03:41 AM
On Wednesday, the GBP/USD currency pair continued trading with an upward bias for some time, but it resumed its decline in the afternoon. From our perspective, the U.S. dollar has weakened significantly in recent months, and now that the global trade war appears to be heading toward resolution- or at least stabilization- it would be logical to expect a strengthening of the American currency. However, Tuesday demonstrated that the market is still reluctant to buy the dollar. There is no confidence that Trump won't introduce new tariffs or start a new trade war tomorrow. As a result, on major news such as the reduction of tariffs with China, the dollar gains 140 pips, but on a minor decline in U.S. inflation, which essentially means nothing (since the Federal Reserve still does not intend to ease policy any time soon), the dollar drops 170 pips.
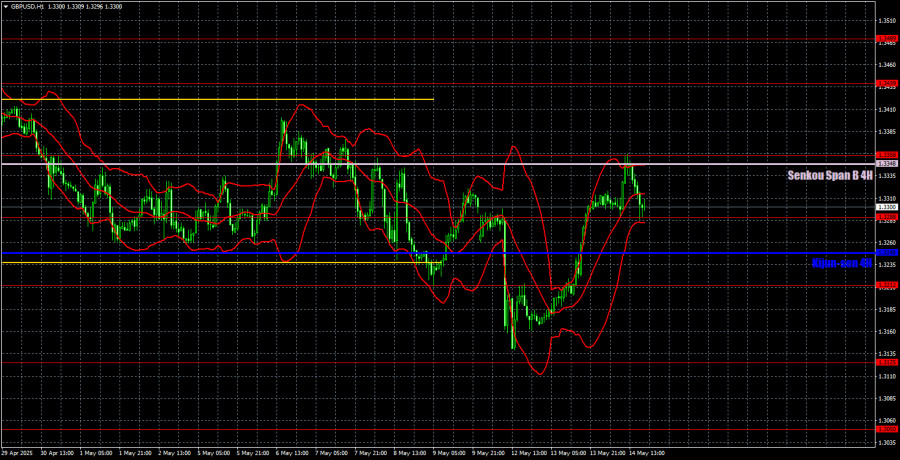
From a technical standpoint, the pair corrected toward the Senkou Span B line and bounced off it. Therefore, a resumption of the downward movement is possible. However, the last round of the pair's decline was driven by specific events: the Fed meeting, the Bank of England meeting, the signing of a trade deal between the UK and the U.S., and the reduction of tariffs between China and the U.S. The question is whether traders will want to buy the dollar again if there are no major dollar-positive developments in the near term.
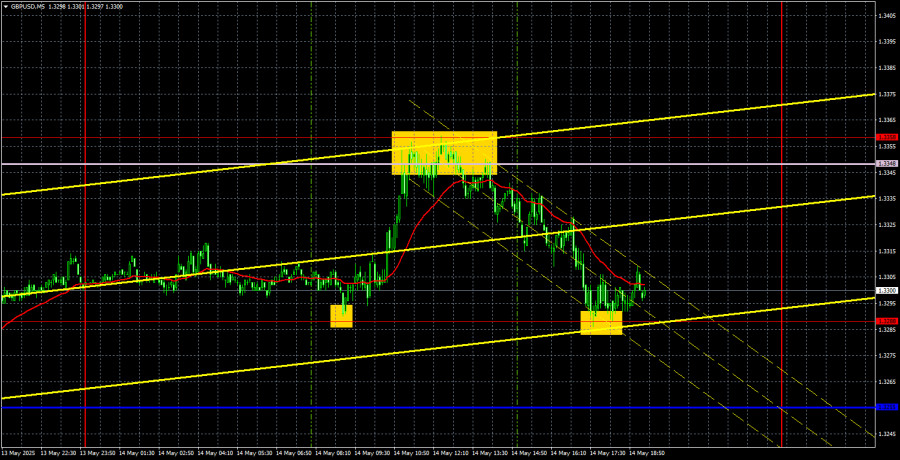
In the 5-minute time frame, the pair showed very clean technical movements yesterday. First, it rebounded almost precisely from the 1.3288 level, then rose to the next target at the 1.3348–1.3358 area. After bouncing off this area, it fell back to 1.3288. This gave traders two opportunities to enter the market, and each trade ended in a profit of about 40–50 points.
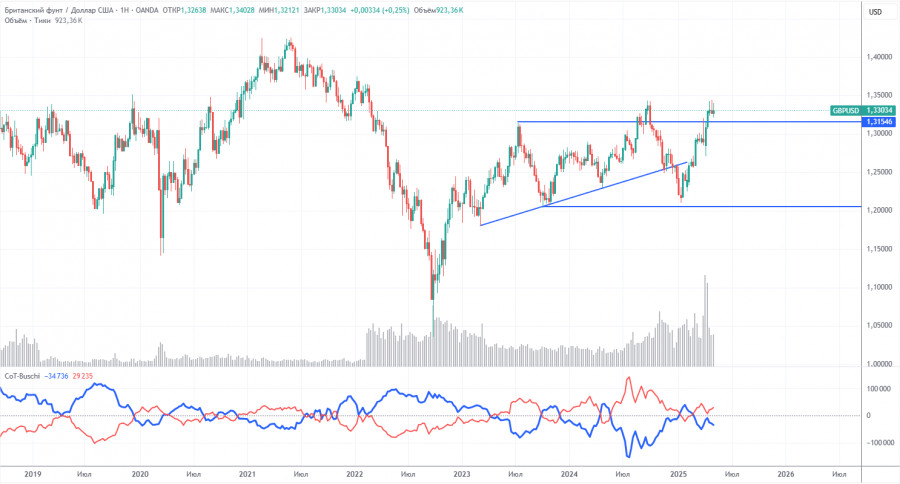
COT reports for the British pound show that commercial traders' sentiment has fluctuated frequently in recent years. The red and blue lines, representing net positions of commercial and non-commercial traders, cross regularly and typically remain near the zero line. They are again close to each other, indicating roughly equal numbers of long and short positions.
In the weekly timeframe, the price broke below the 1.3154 level, then broke a trend line, returned to 1.3154, and broke again. Breaking the trend line indicates a high probability that the pound will continue to fall. However, we see that the dollar keeps dropping due to Donald Trump. Therefore, the trade war news could continue pushing the pound higher despite technical factors.
According to the latest COT report on the British pound, the "Non-commercial" group opened 3,300 long contracts and closed 1,900 short contracts, increasing their net position by 5,200 contracts.
The fundamental backdrop still offers no justification for long-term purchases of the pound sterling, and the currency has real chances to resume a global downtrend. The pound has risen sharply recently, but we must remember that Donald Trump's policy is the sole reason. Once that factor is removed, the dollar may begin to strengthen.
In the hourly time frame, GBP/USD finally broke out of the sideways channel and began a downward movement. However, it didn't last long. The continuation of the decline will depend entirely on Donald Trump and the unfolding situation in the global trade war. If tensions continue to ease and more trade deals are signed, the dollar could resume growth. However, it is important to note that the market still does not favor the U.S. dollar and lacks confidence in de-escalating the trade conflict.
For May 15, the following key levels are identified: 1.2691–1.2701, 1.2796–1.2816, 1.2863, 1.2981–1.2987, 1.3050, 1.3125, 1.3212, 1.3288, 1.3358, 1.3439, 1.3489, 1.3537. The Senkou Span B (1.3348) and Kijun-sen (1.3248) lines can also serve as sources of signals. A Stop Loss should be moved to breakeven once the price moves 20 pips in the desired direction. Ichimoku lines may shift throughout the day, so traders should remember this when identifying signals.
On Wednesday, the UK is set to publish second estimates of Q1 GDP and industrial production data. In the U.S., the most significant release will be retail sales. These reports are unlikely to provoke a strong market reaction but may trigger a modest one.
You have already liked this post today
*A análise de mercado aqui postada destina-se a aumentar o seu conhecimento, mas não dar instruções para fazer uma negociação.
Análise das negociações de sexta-feira Gráfico 1H do EUR/USD Na sexta-feira, o par EUR/USD registrou uma queda significativa, apesar da ausência de fatores macroeconômicos ou fundamentais claros. Ainda assim
Na minha previsão matinal, destaquei o nível 1,1378 e planejei basear as decisões de entrada no mercado nele. Vamos dar uma olhada no gráfico de 5 minutos e analisar
Na minha previsão matinal, concentrei-me no nível 1,1358 e planejei tomar decisões de negociação com base nele. Vamos dar uma olhada no gráfico de 5 minutos para entender
Análise das operações de segunda-feira Gráfico 1H do EUR/USD O par EUR/USD iniciou a segunda-feira com uma forte recuperação. Durante a madrugada, o euro avançou entre 100 e 120 pips
Análise das operações de quinta-feira Gráfico 1H do GBP/USD Nas últimas 24 horas, o par GBP/USD avançou 170 pips, e a valorização da libra esterlina continuou durante a madrugada desta
Análise das operações de sexta-feira Gráfico 1H do GBP/USD O par GBP/USD registrou uma forte correção na sexta-feira, um movimento difícil de justificar — mesmo com a vantagem da retrospectiva
Análise das operações de sexta-feira Gráfico 1H de EUR/USD O par EUR/USD permaneceu sob forte instabilidade nesta sexta-feira. Desta vez, o movimento de baixa predominou — mas isso não tornou
Na minha previsão matinal, destaquei o nível 1,0994 e planejei basear minhas decisões de entrada no mercado nele. Vamos dar uma olhada no gráfico de 5 minutos e analisar
Contas PAMM
da InstaForex

Your IP address shows that you are currently located in the USA. If you are a resident of the United States, you are prohibited from using the services of InstaFintech Group including online trading, online transfers, deposit/withdrawal of funds, etc.
If you think you are seeing this message by mistake and your location is not the US, kindly proceed to the website. Otherwise, you must leave the website in order to comply with government restrictions.
Why does your IP address show your location as the USA?
Please confirm whether you are a US resident or not by clicking the relevant button below. If you choose the wrong option, being a US resident, you will not be able to open an account with InstaTrade anyway.
We are sorry for any inconvenience caused by this message.


