Veja também

 20.05.2025 05:40 AM
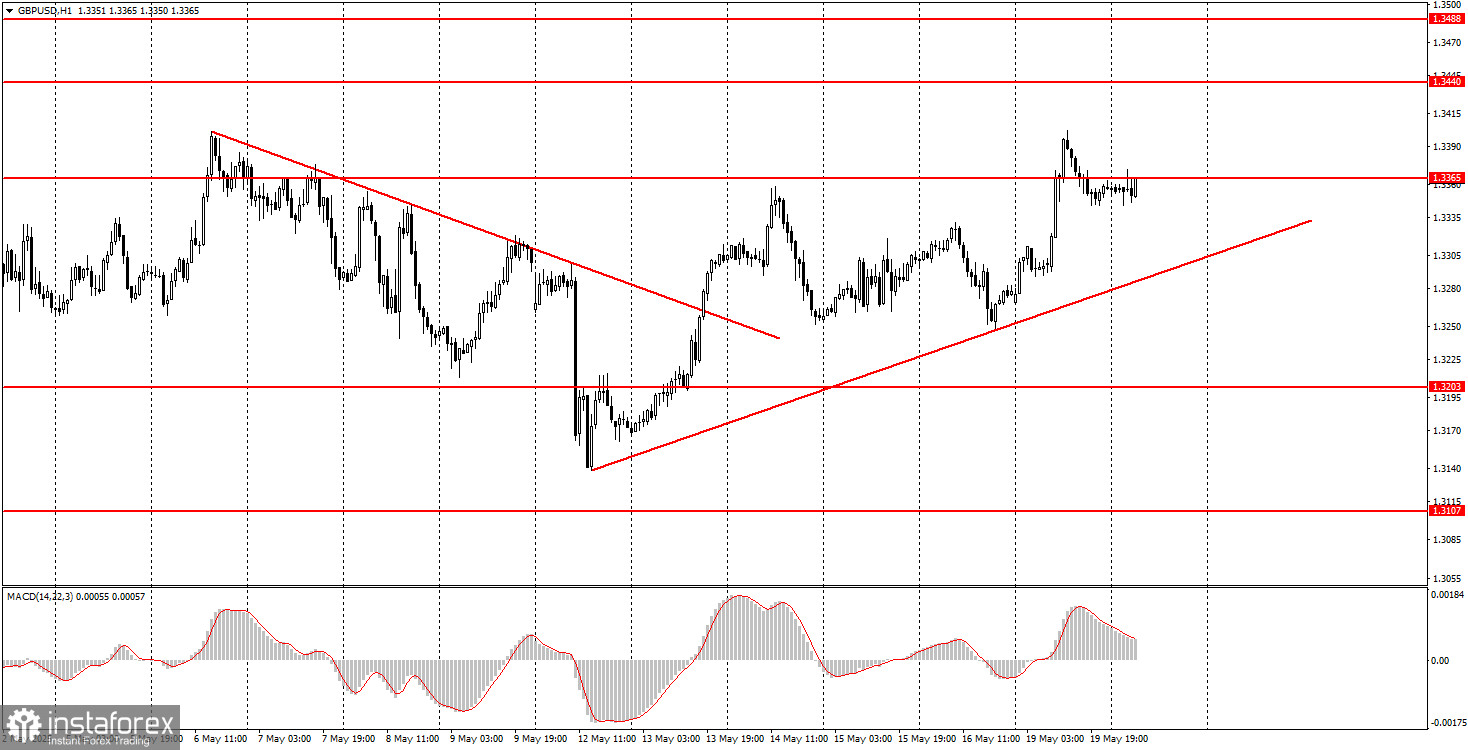
Throughout Monday, the GBP/USD pair continued its upward movement, and at first glance, it might seem that a new uptrend is forming on the hourly time frame. In principle, this is indeed the case, as evidenced by the breakout above the old trendline and the formation of a new one. However, if you zoom out or switch to a higher time frame, it becomes clear that the pair has been in a sideways range for over a month. Only once during this time did the price leave the sideways channel of 1.3203–1.3440, and even then only briefly.
Now that the price is approaching the upper boundary of the range, we can reasonably expect a reversal downward and another drop in the British currency within this flat range. However, it's crucial to note that the market is currently willing to sell the dollar under nearly any circumstance, as demonstrated on Monday. The pair remained stagnant for a month and couldn't even mount a proper correction. From our perspective, this may suggest the market is ready to resume the three-month uptrend. Even the easing of global trade tensions has failed to help the struggling dollar.
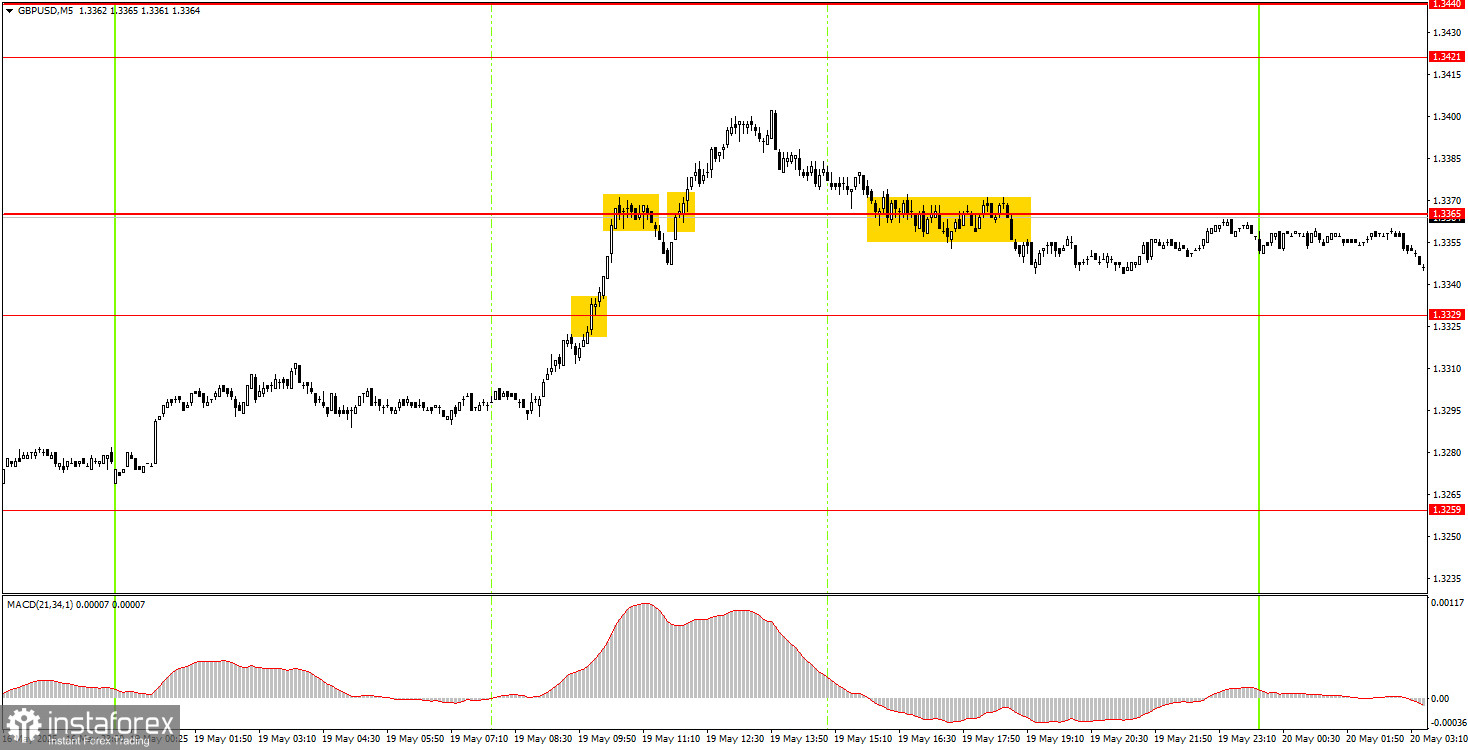
On Monday, several trade signals were formed on the 5-minute time frame, though all of them were objectively weaker than those for the euro. First, the pair broke through the 1.3329 level, but around 1.3365, a false sell signal was generated, which spoiled the setup. The breakout of 1.3365 was also false. A consolidation below 1.3365 produced no follow-through.
Thus, only the very first buy signal yielded a profit. The second trade closed at a loss, while the third and fourth trades broke even.
In the 1-hour time frame, the GBP/USD pair focuses solely on Donald Trump, remaining highly skeptical of his policies. Let's recall that even the signing of a trade agreement between the U.S. and the UK is more of a positive for the dollar, not the pound, since it was the dollar that fell on every tariff or sanctions announcement. Now, the dollar is expected to recover on any news of trade de-escalation. However, the market still seems unwilling to trust the U.S. currency.
On Tuesday, the GBP/USD pair will trade primarily on technical factors again. We can safely assume that the market will look for another excuse to sell the dollar or wait for news. The market situation remains unchanged day after day.
On the 5-minute timeframe, you can now trade at the levels of 1.2848-1.2860, 1.2913, 1.2980-1.2993, 1.3043, 1.3102-1.3107, 1.3203-1.3211, 1.3259, 1.3329, 1.3365, 1.3421-1.3440, 1.3488, 1.3537, 1.3580-1.3598. No major economic events are scheduled in the UK or the U.S. for Tuesday, so we will likely see range-bound trading again. Of course, Donald Trump could make headlines anytime, or news of a trade deal with some country could emerge. But such developments cannot be predicted in advance.
Support and Resistance Levels: These are target levels for opening or closing positions and can also serve as points for placing Take Profit orders.
Red Lines: Channels or trendlines indicating the current trend and the preferred direction for trading.
MACD Indicator (14,22,3): A histogram and signal line used as a supplementary source of trading signals.
Important Events and Reports: Found in the economic calendar, these can heavily influence price movements. Exercise caution or exit the market during their release to avoid sharp reversals.
Forex trading beginners should remember that not every trade will be profitable. Developing a clear strategy and practicing proper money management are essential for long-term trading success.


