Veja também

 16.06.2025 04:53 AM
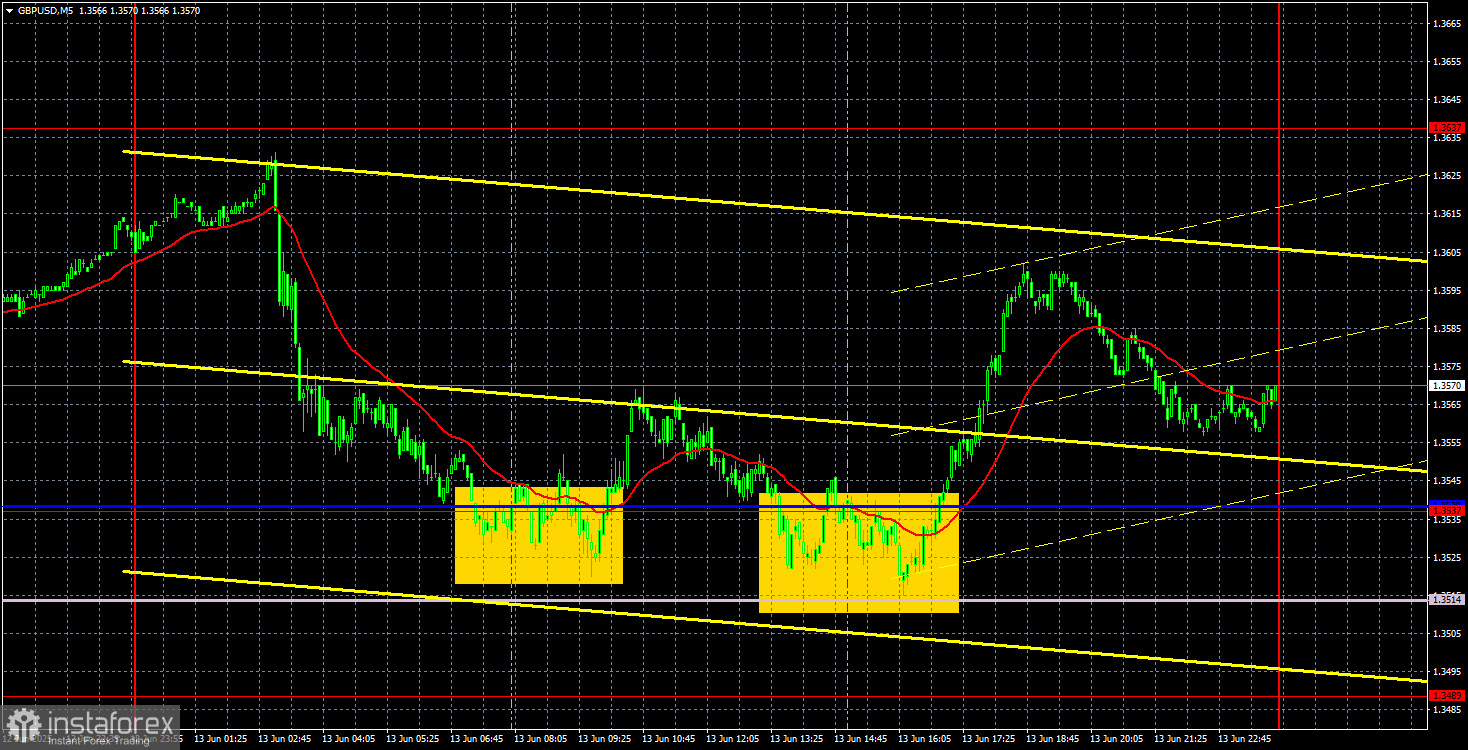
On Friday, the GBP/USD currency pair continued its upward movement. To better understand what's happening with the British pound, it's best to switch to the daily timeframe. There, we observe a strong rally that began precisely on the day of Donald Trump's inauguration. Since then, we've seen at most three tiny corrections. In other words, the pound has steadily risen with hardly any pauses. Naturally, on the lower timeframes, the movement doesn't appear one-directional. Corrections still occur, sometimes lasting several weeks. However, that doesn't alter the fundamental fact—the dollar's value continues to decline.
On Friday, the pair's macroeconomic background was weak and irrelevant to traders. The University of Michigan Consumer Sentiment Index for June significantly exceeded forecasts. However, in the second half of the day, the dollar only fell as the market quickly realized that buying the U.S. currency amid escalating geopolitical conflict in the Middle East wasn't the wisest idea. As a result, the dollar's overnight growth was completely offset during the rest of the day.
In recent weeks, the pair has been moving more sideways than upward on the hourly timeframe. However, the uptrend remains intact even in this timeframe, and breaking through trend lines or channels currently holds little technical significance.
In the 5-minute timeframe, two trading signals were generated on Friday. The pair bounced twice from the Ichimoku Senkou Span B and Kijun-sen lines. The first move gained only 12 pips, so traders could have remained in long positions by the time the second buy signal formed. The second upward move was stronger than the first, though still relatively weak. Nonetheless, a small profit could have been made from the single trade.
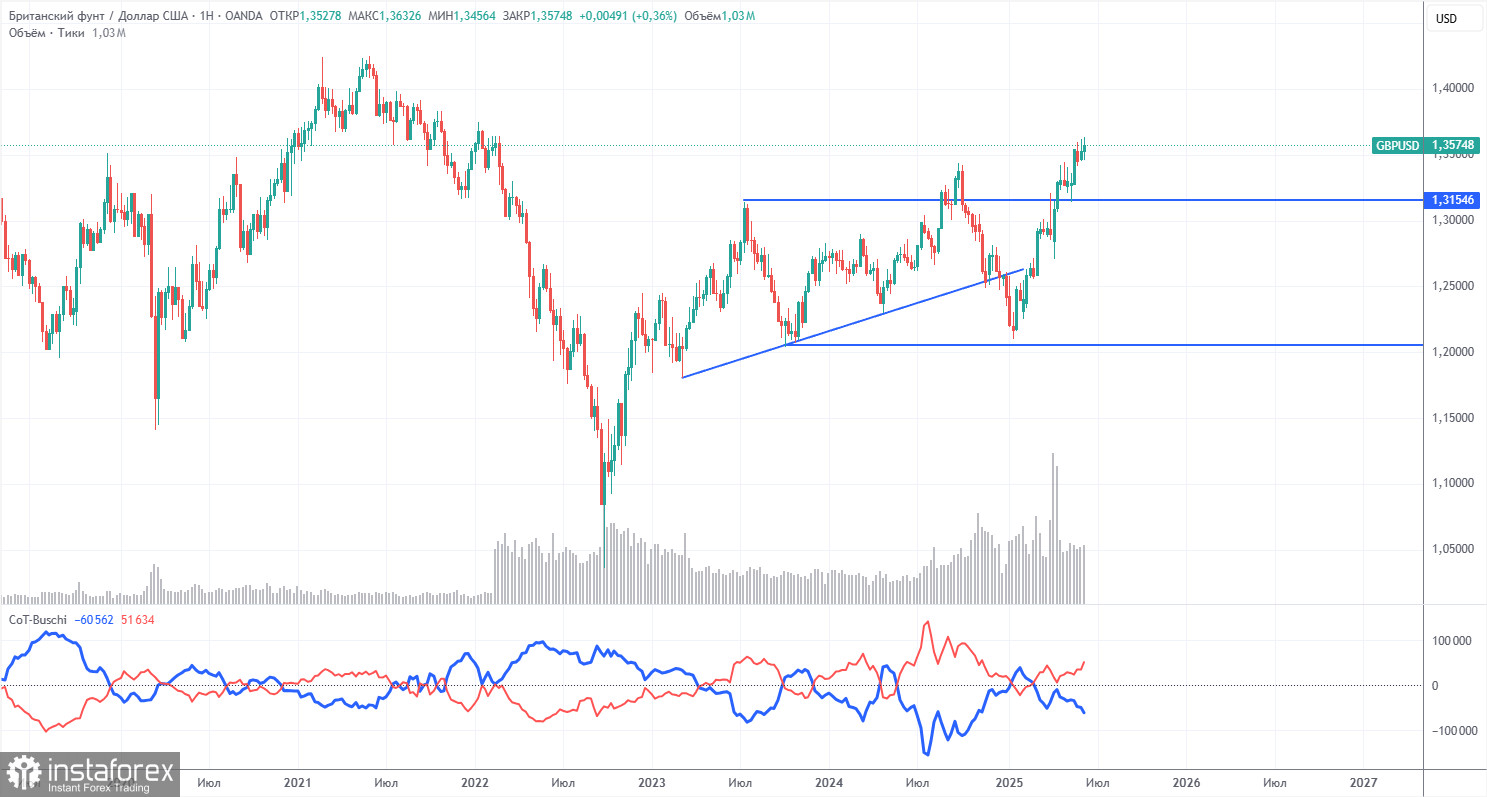
COT (Commitment of Traders) reports on the British pound show that commercial trader sentiment has fluctuated continuously in recent years. The red and blue lines representing net positions of commercial and non-commercial traders frequently cross and mostly hover near the zero mark. They are still close to each other, indicating an approximate balance of buy and sell positions. However, the net position has grown over the past year and a half.
The dollar continues to decline due to Trump's policies, so market makers' demand for the pound isn't particularly crucial at the moment. If the de-escalation of the global trade war resumes, the U.S. dollar could have a chance to rebound. According to the latest report on the British pound, the "Non-commercial" group opened 7,400 BUY contracts and closed 9,000 SELL contracts. As a result, the net position of non-commercial traders increased by 16,400 thousand contracts over the reporting week—a significant gain.
Recently, the pound has strengthened sharply, but the reason is singular—Trump's policies. Once this factor is neutralized, the dollar may start to recover. But when will that happen? No one knows. Trump is still in the early phase of his presidency. What other shocks await in the next four years?
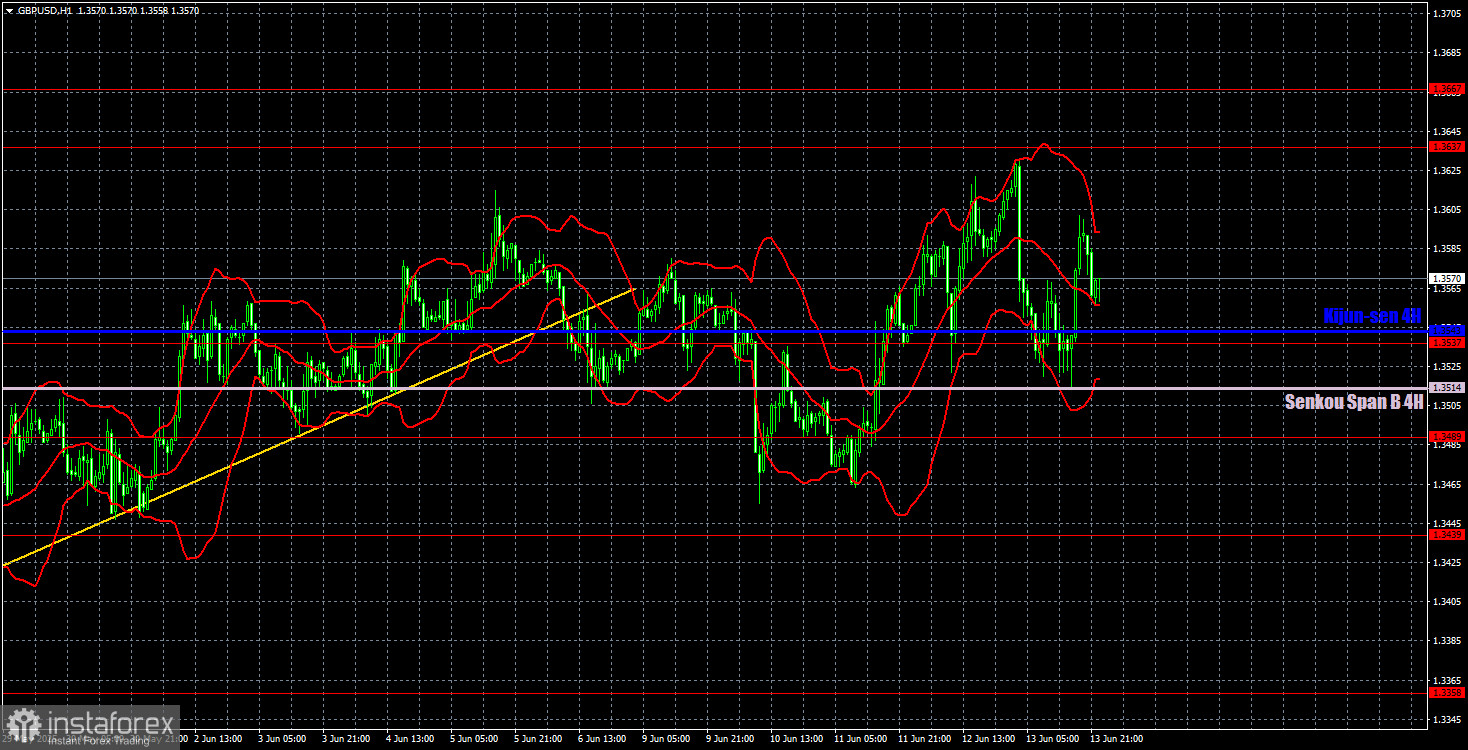
In the hourly timeframe, GBP/USD retains its upward trend despite consolidating below the ascending channel and trendline. The U.S. dollar again saw only a minor correction while the market focused on buying in the medium term. The Middle East geopolitical conflict could theoretically support the dollar, but we don't believe that will happen. There are no technical reasons to expect a decline—even on the 1-hour chart, let alone the 4-hour or daily charts.
Key Levels for June 16: 1.2981–1.2987, 1.3050, 1.3125, 1.3212, 1.3288, 1.3358, 1.3439, 1.3489, 1.3537, 1.3637–1.3667, 1.3741. The Senkou Span B line (1.3514) and the Kijun-sen line (1.3543) may also serve as signal sources. A Stop Loss should be set to breakeven once the price moves 20 pips in the right direction. Ichimoku indicator lines may shift throughout the day and should be considered when identifying trade signals.
No major events are scheduled in the UK or the U.S. for Monday. However, we believe that traders will remain tense and emotional throughout the day, which could lead to sharp and volatile price movements and frequent reversals.


