Veja também

 23.06.2025 06:03 PM
In my morning forecast, I focused on the 1.1505 level and planned to make trading decisions based on it. Let's look at the 5-minute chart and analyze what happened. A breakout and retest of 1.1505 provided an entry point for buying the euro, but a strong upward movement did not materialize. The technical outlook was revised for the second half of the day.
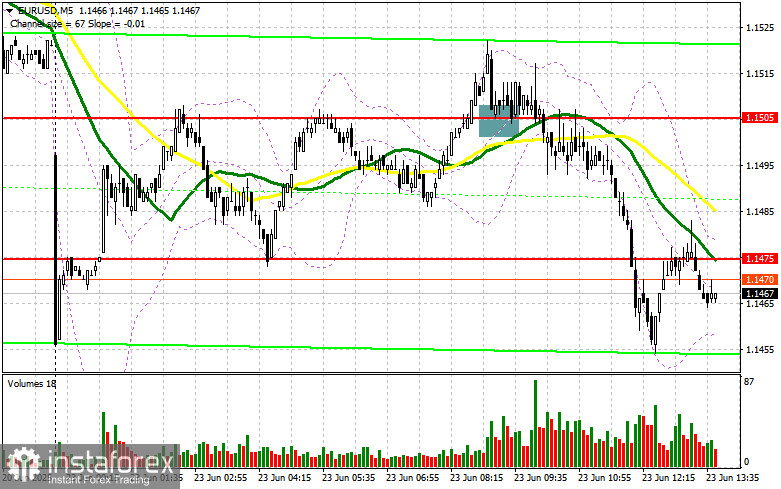
To Open Long Positions on EUR/USD:
Weak PMI data from Eurozone countries negatively affected the euro during the first half of the day, reviving the pressure seen during the Asian session. In the second half of the day, we expect similar reports from the U.S., including the Manufacturing PMI, Services PMI, and Composite PMI for June. Speeches by FOMC members Michelle Bowman and John Williams should also not be overlooked.
If the euro declines further after the data, I will act near the 1.1448 support level. A false breakout there will be a reason to buy EUR/USD, expecting a recovery and a retest of the 1.1498 resistance formed earlier today. A breakout and retest of this range will confirm a correct entry point, with the target at 1.1542. The ultimate target will be 1.1579, where I will take profits.
If EUR/USD declines and there's no activity around 1.1448, pressure on the pair will increase, potentially leading to a sharper drop. In this case, bears may push the pair down to 1.1408. I will consider buying the euro only after a false breakout at that level. I plan to open long positions on a rebound from 1.1377, targeting a 30–35 point intraday upward correction.
To Open Short Positions on EUR/USD:
Sellers were active earlier today, and renewed tensions in the Middle East are again putting pressure on the euro. Iran launched mortar attacks on a U.S. military base in Syria's Hasakah province, which could further escalate the situation. Against this backdrop, selling risk assets appears to be a more suitable strategy.
If the pair makes another attempt to rise after U.S. data, a false breakout around 1.1498 will be a signal to open short positions targeting 1.1448. A breakout and consolidation below this range will support selling with a move toward 1.1408. The final target will be 1.1377, where I will take profit.
If EUR/USD rises in the second half of the day and bears are inactive near 1.1498, where the moving averages are located, buyers could push the pair higher and retest 1.1542. I will sell only after a failed consolidation there. I plan to open short positions on a rebound from 1.1579, targeting a 30–35 point intraday downward correction.
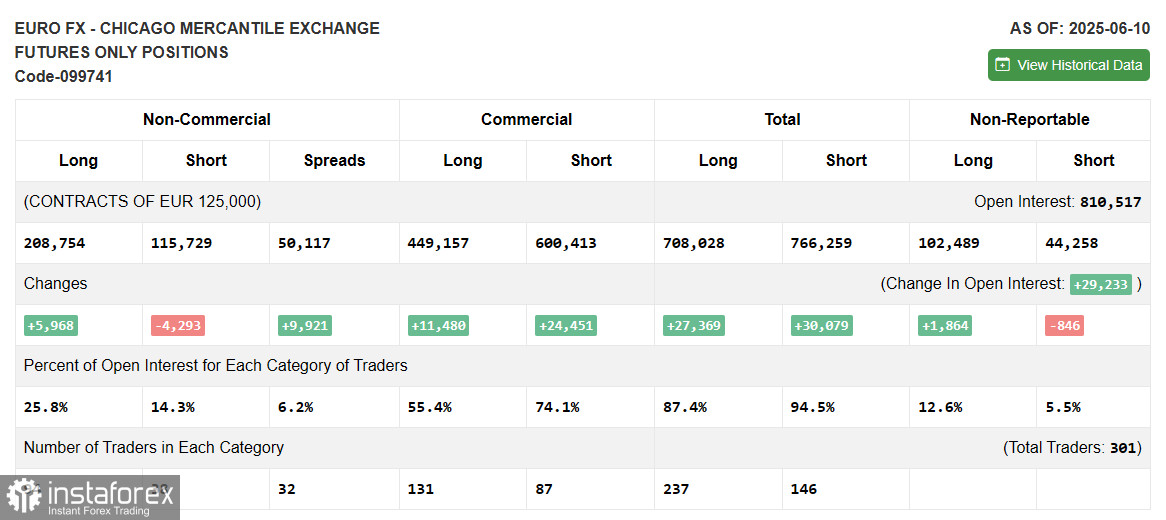
COT Report (Commitment of Traders) as of June 10:
The report showed a reduction in short positions and an increase in long positions. Although U.S. inflation data showed a sharp decline, it failed to provide the dollar with the necessary support—despite clear signals that the Federal Reserve will likely keep rates unchanged for now. Much more important will be Powell's comments on the inflation situation and his projections for rate cuts this fall. These will shape the future direction of the EUR/USD pair, which is still showing upward potential according to the report.
The COT report indicated that long non-commercial positions rose by 5,968 to 208,754, while short non-commercial positions fell by 4,293 to 115,729. As a result, the gap between long and short positions widened by 9,921.
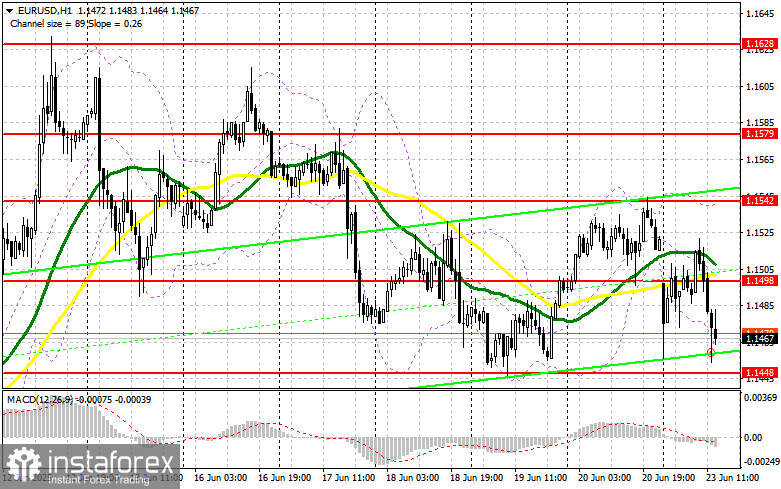
Indicator Signals:
Moving AveragesTrading is below the 30- and 50-day moving averages, indicating further downside for the euro.
Note: The period and prices of the moving averages are based on the author's H1 chart analysis and differ from the classic daily MAs on the D1 chart.
Bollinger Bands If the pair declines, the lower boundary of the indicator around 1.1450 will act as support.
Indicator Descriptions:


