Veja também

 25.06.2025 06:36 AM
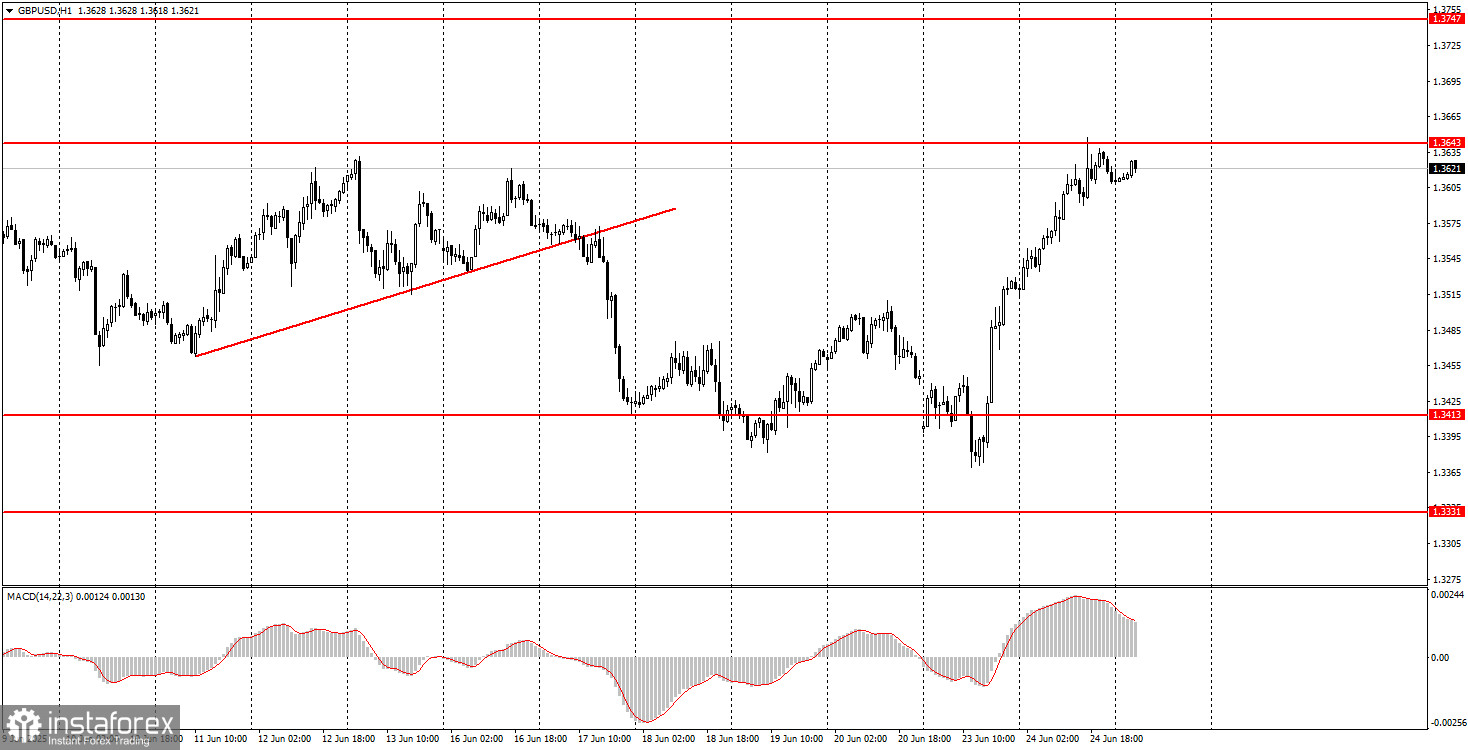
On Tuesday, the GBP/USD pair continued its upward movement, even stronger than the EUR/USD pair. The reason behind the new rise of the British currency (read: the fall of the dollar) was the de-escalation of the conflict in the Middle East. On Tuesday, Donald Trump announced a ceasefire between Israel and Iran, which was later confirmed by both nations. Against this backdrop, no one was interested in Andrew Bailey's or Jerome Powell's speeches.
We had warned that the Bank of England and the Federal Reserve meetings had taken place very recently, so there was no chance of receiving any new information. Powell repeated in Congress all the points he had already voiced several times in recent months. He doesn't care about Trump's criticism, repeated insults, or calls to lower the key interest rate. Bailey didn't even address monetary policy. As a result, the market could only respond to the de-escalation of military actions between Iran and Israel while simultaneously scrolling through social media, where Trump was posting angry messages every half hour.
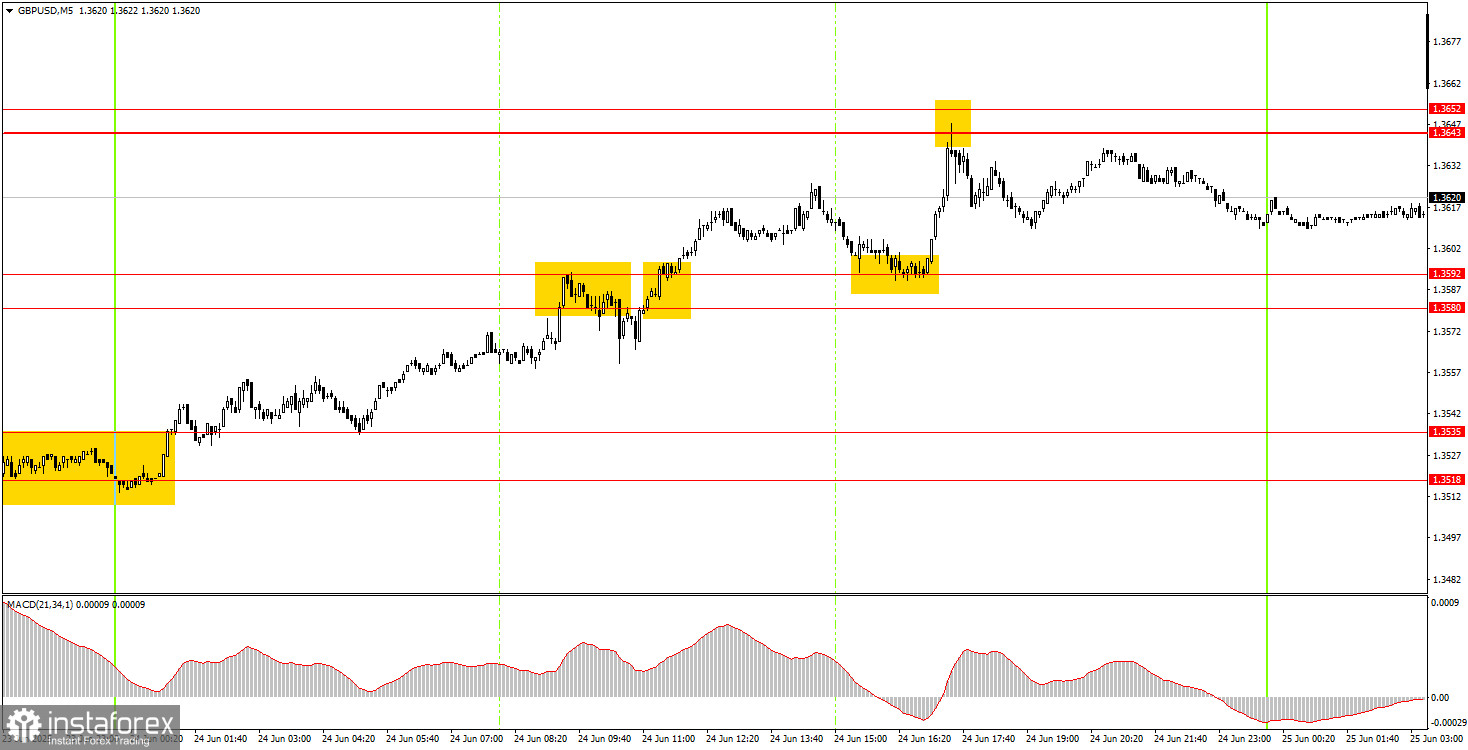
On the 5-minute timeframe, several trading signals that were worth paying attention to formed on Tuesday. The first buy signal appeared near the 1.3518–1.3535 zone overnight. This was followed by a false bounce from the 1.3580–1.3592 area and a breakout above this zone. A little later, another bounce from the same area occurred, leading to the long-awaited target of 1.3643–1.3652 being reached. The uptrend continues, and the British pound has updated its highs of the past three years.
On the hourly timeframe, the GBP/USD pair focuses exclusively on Trump and remains highly skeptical of his policies. As a result, the market continues to sell the dollar or wait for the next wave of negative news from overseas to sell it again. This will likely continue until the market sees real signs of the end of the trade war and until Trump stops making decisions beyond his authority that make market participants' hair stand on end. The dollar may still post gains from time to time—it cannot fall every single day—but such events remain extremely rare for now.
On Wednesday, the GBP/USD pair may continue its upward movement as the downward trend appears to be over. The Middle East conflict is resolved, and the dollar has lost yet another factor of market support.
On the 5-minute timeframe, trading can currently be conducted using the following levels: 1.3043, 1.3102–1.3107, 1.3203–1.3211, 1.3259, 1.3329–1.3331, 1.3413–1.3421, 1.3518–1.3535, 1.3580–1.3592, 1.3643–1.3652, 1.3695, 1.3740. Powell's second testimony before the U.S. Congress is scheduled for Wednesday, but it is unlikely to differ significantly in content from the first. Therefore, the pair must overcome the 1.3643 level and calmly move upward.
Support and Resistance Levels: These are target levels for opening or closing positions and can also serve as points for placing Take Profit orders.
Red Lines: Channels or trendlines indicating the current trend and the preferred direction for trading.
MACD Indicator (14,22,3): A histogram and signal line used as a supplementary source of trading signals.
Important Events and Reports: Found in the economic calendar, these can heavily influence price movements. Exercise caution or exit the market during their release to avoid sharp reversals.
Forex trading beginners should remember that not every trade will be profitable. Developing a clear strategy and practicing proper money management are essential for long-term trading success.


