Veja também

 07.07.2025 07:03 AM
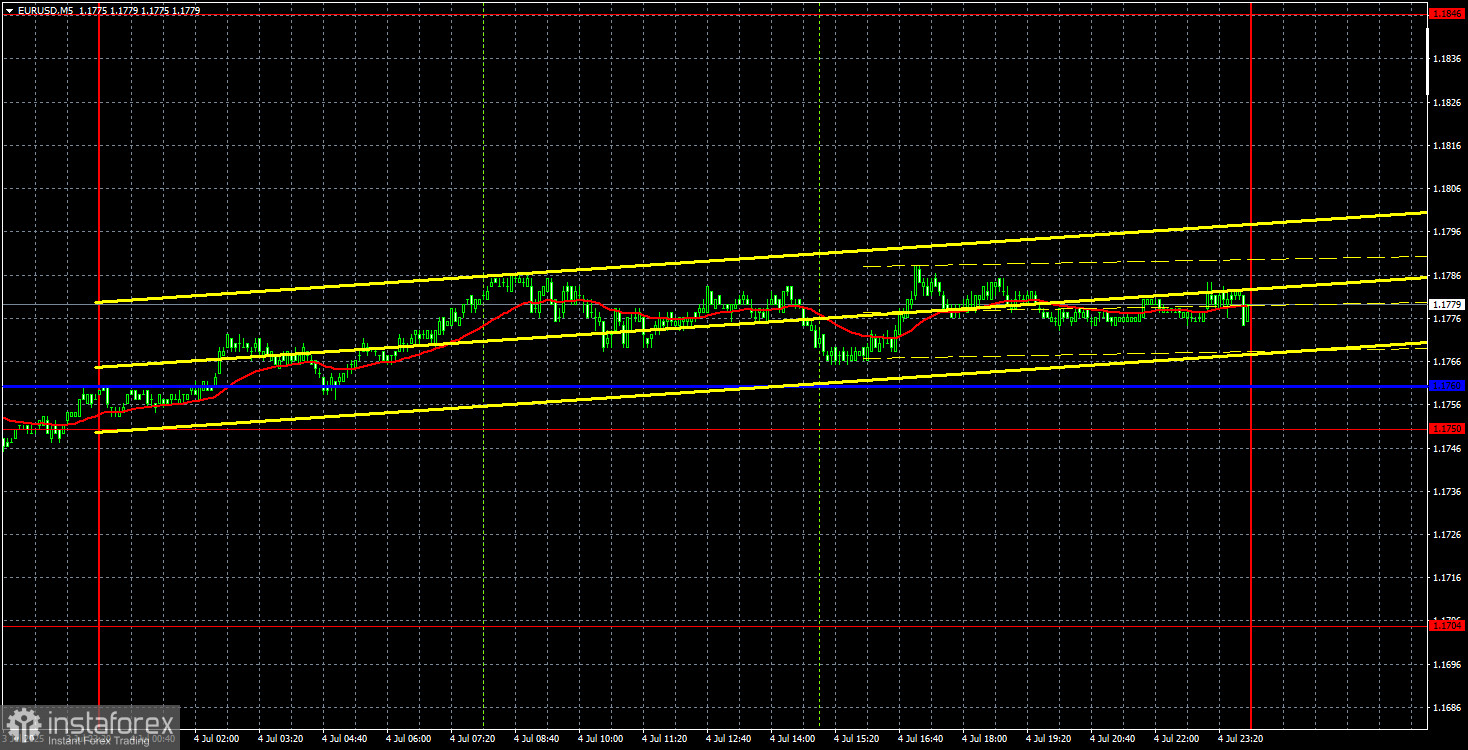
The EUR/USD currency pair did not exhibit any notable movements on Friday—or any movements at all. Friday was Independence Day in the United States, effectively making it a non-trading day. Although some fundamental news was released on that day, as well as on Saturday and Sunday, it remains to be seen whether the market will consider these developments significant. If so, we may see new sharp movements on Monday; otherwise, the flat trend could continue.
Currently, the technical picture for EUR/USD remains clear. Following another surge in the euro's value, the pair did not begin a downward correction but instead entered an intensified sideways range. This type of price behavior indicates a lack of sellers (or dollar buyers) in the market. Once again, the market has shown its unwillingness to invest in the U.S. dollar—even in the face of strong U.S. statistics. The reason lies in Donald Trump's trade policies, his "One Big Beautiful Law," the conflict with Elon Musk, and other disruptive events that seem aimed at weakening the American economy. Whether that is truly the case or not is irrelevant. What matters is how the market perceives these events—and traders are interpreting them in a very clear way.
No trading signals were generated on Friday, and overall volatility was less than 40 points. Thus, there were no reasons for traders to open positions.
COT Report
The latest COT report is dated June 24. As shown in the chart above, the net position of non-commercial traders had remained bullish for an extended period. Bears briefly gained control at the end of 2024 but quickly lost it. Since Trump took office, the dollar has only been declining. While we cannot say with 100% certainty that the dollar's decline will continue, current global developments suggest this scenario is likely.
We still do not see any fundamental factors supporting the euro's growth. However, one major factor continues to weigh on the dollar. The long-term downtrend remains intact—but what relevance does a 16-year trend have now? The dollar might begin to rise again if Trump ends his trade wars—but will he? And when?
Currently, the red and blue lines have crossed again, indicating a renewed bullish trend. During the latest reporting week, the number of long positions in the "Non-commercial" group increased by 3.0k, while short positions decreased by 6.6k. As a result, the net position grew by another 9.6k contracts.
EUR/USD 1H Analysis
On the hourly chart, EUR/USD continues to move almost without pullbacks, a pattern observable on any chart above the hourly timeframe. A constant stream of news from the U.S. continues to push traders to sell dollars. Even strong macroeconomic data from the U.S. fails to attract dollar buyers. Donald Trump's policies are undermining the U.S. dollar's status as a global reserve currency. This week, the global trade war could escalate to a new level, and a full-scale political conflict between Elon Musk and Donald Trump may erupt.
Key Trading Levels for July 7:1.1092, 1.1147, 1.1185, 1.1234, 1.1274, 1.1362, 1.1426, 1.1534, 1.1615, 1.1666, 1.1750, 1.1846–1.1857, and the Ichimoku lines Senkou Span B (1.1642) and Kijun-sen (1.1766). Note that Ichimoku indicator lines can shift throughout the day, which must be taken into account when identifying signals.
Don't forget to set a breakeven Stop Loss if the price moves 15 points in the right direction. This will help protect against losses if the signal turns out to be false.
On Monday, the EU will release minor reports on retail sales and German industrial production. The U.S. calendar is empty. However, there was enough news on Friday and Saturday that could prompt traders to "re-engage" on Monday. These developments are unlikely to favor the U.S. dollar.
Explanation of Chart Elements:


