Veja também

 04.08.2025 06:14 AM
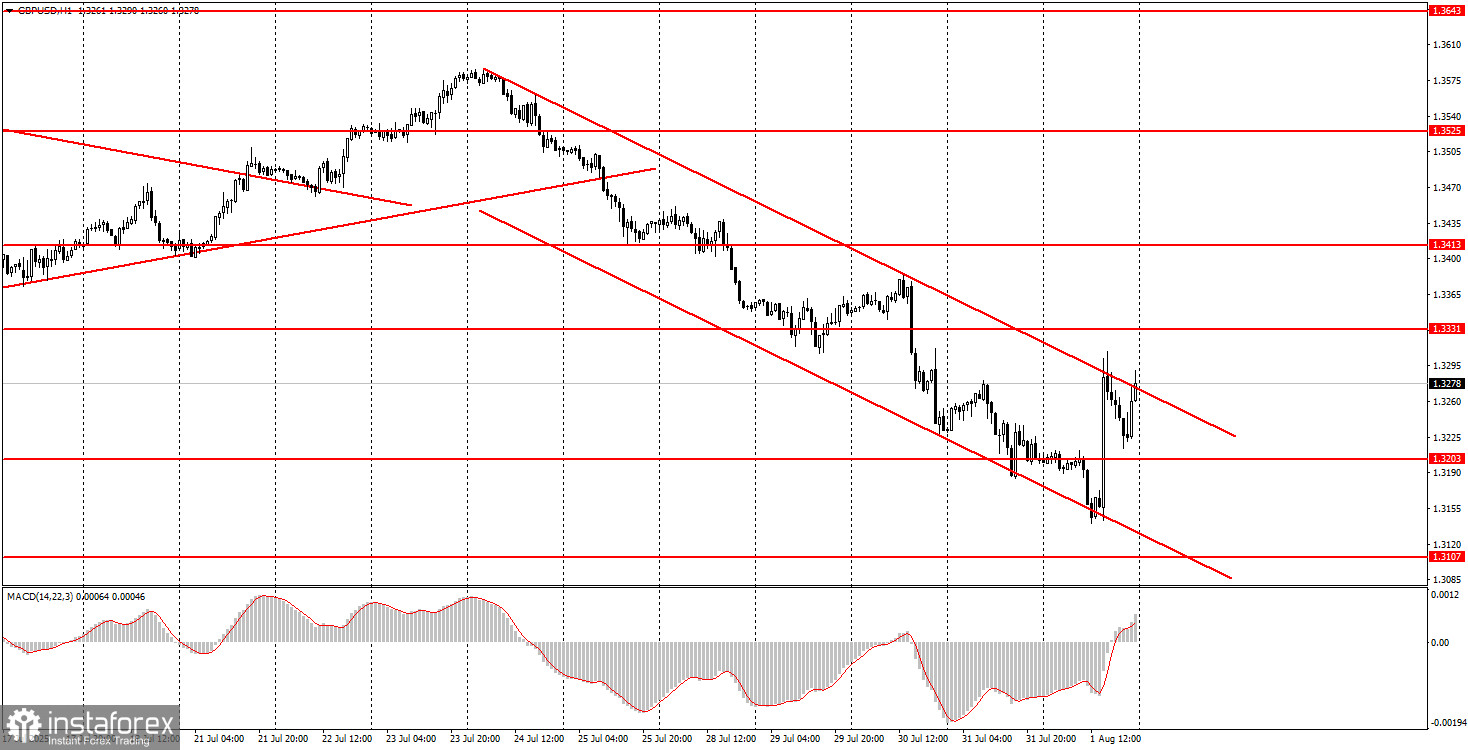
The GBP/USD pair also showed wild movements on Friday, triggered not only by labor market data, but also by unemployment figures, manufacturing sector activity, and new surprises from Donald Trump. On Friday, traders witnessed firsthand how quickly the situation can flip upside down within a matter of hours. Trump spoke about being ready for nuclear war with Russia, introduced new tariffs against 60 countries, the U.S. manufacturing sector once again demonstrated its weakness (further proving the artificial nature of the strong Q2 GDP growth), unemployment rose, and we already discussed Nonfarm Payrolls. That's it. Who now can say that the dollar's recent rise was justified and that it will continue to climb to the top?
The GBP/USD pair remains within a descending channel, but we expect a breakout above it and a new wave of the uptrend that began in January of this year.
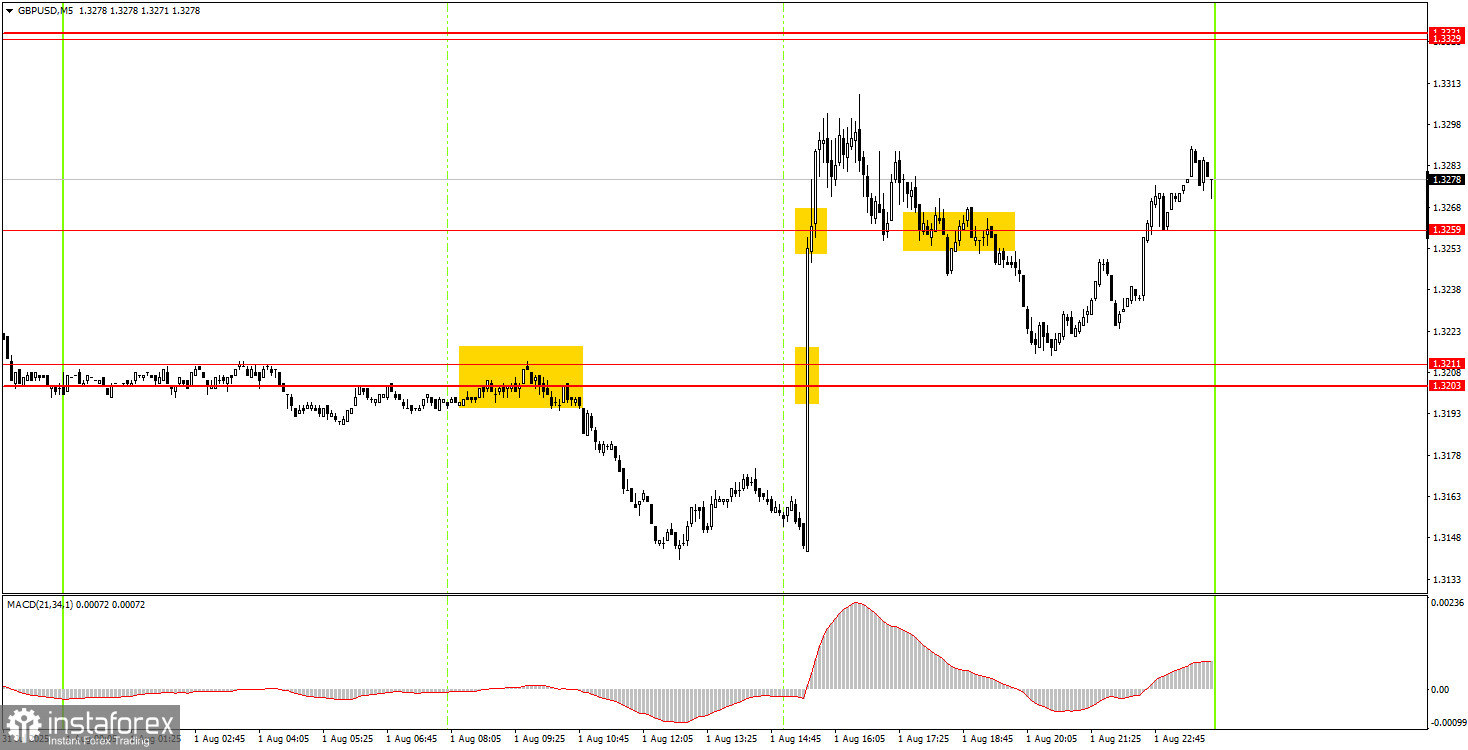
On the 5-minute timeframe on Friday, a large number of trading signals were generated, but traders could realistically work with only the very first one. During the European session, the price rebounded quite accurately from the 1.3203–1.3211 area and then moved about 45 pips downward. Since it was best to close any positions (or at least move the Stop Loss to breakeven) before the U.S. data were published, this trade could even have yielded a profit. All subsequent signals made no sense to trade – another "storm" had begun.
On the hourly timeframe, the GBP/USD pair shows that the downward technical correction is still ongoing. However, after Friday's news, we wouldn't bet a dime on the dollar's strength. We expect a breakout above the descending channel and the start of a new downtrend for the U.S. currency.
On Monday, the GBP/USD pair may continue its upward movement. The market will need some time to recover and, once again, start paying attention to technical levels. Some of these levels may need to be adjusted.
On the 5-minute timeframe, you can currently trade using the following levels: 1.3102–1.3107, 1.3203–1.3211, 1.3259, 1.3329–1.3331, 1.3413–1.3421, 1.3466, 1.3518–1.3532, 1.3574–1.3590, 1.3643–1.3652, 1.3682, 1.3763.
No important data or events are scheduled in the UK or the U.S. for Monday, but volatility throughout the day may still be quite high—traders had little time to react to the U.S. data on Friday before the market closed.
Support and Resistance Levels: These are target levels for opening or closing positions and can also serve as points for placing Take Profit orders.
Red Lines: Channels or trendlines indicating the current trend and the preferred direction for trading.
MACD Indicator (14,22,3): A histogram and signal line used as a supplementary source of trading signals.
Important Events and Reports: Found in the economic calendar, these can heavily influence price movements. Exercise caution or exit the market during their release to avoid sharp reversals.
Forex trading beginners should remember that not every trade will be profitable. Developing a clear strategy and practicing proper money management are essential for long-term trading success.


