Veja também

 13.08.2025 03:49 AM
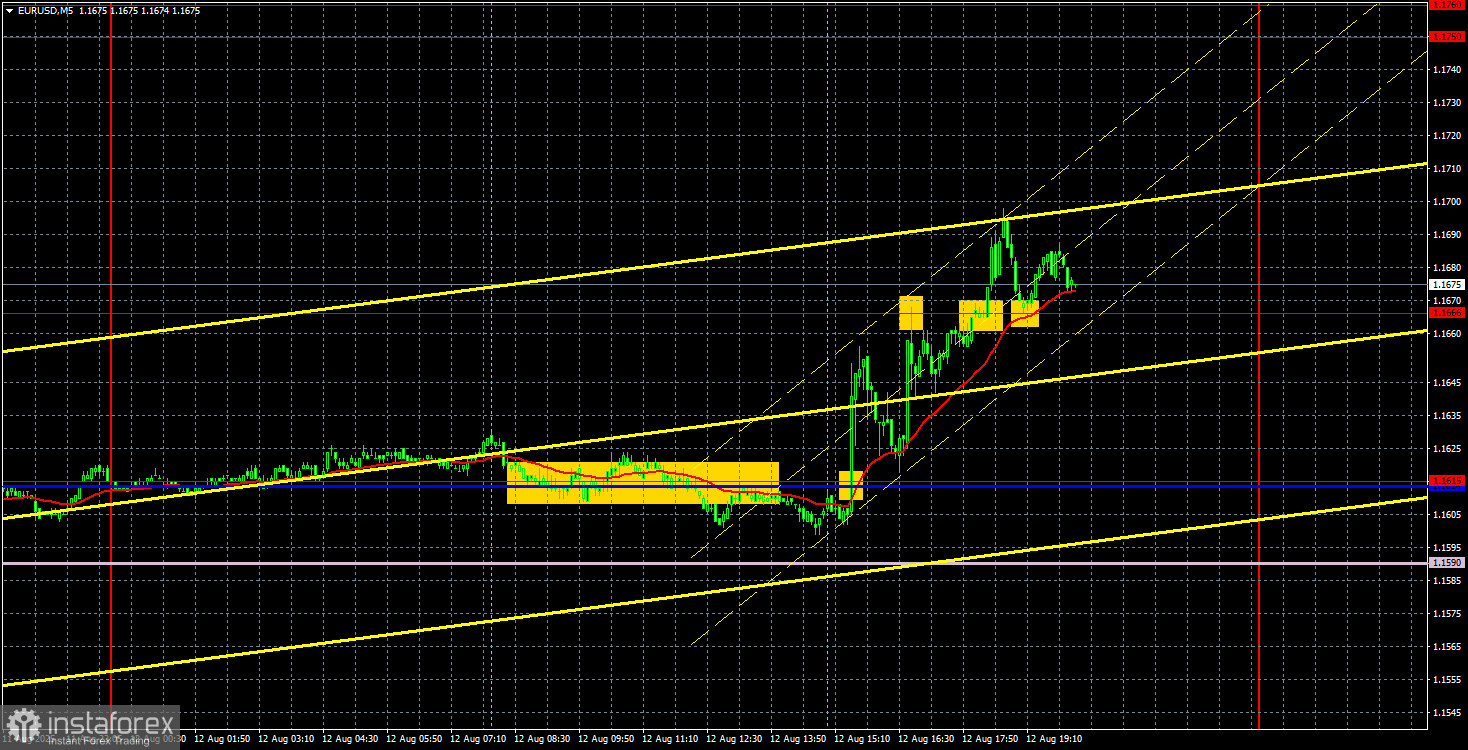
The EUR/USD currency pair resumed its upward movement on Tuesday. This resumption was not without reason—it was entirely logical. While the market confidently ignored the morning European reports, it could not pass by the U.S. Consumer Price Index. Yesterday, we noted that the reaction to this report would most likely be strong, but the report itself does not change anything. Inflation in the U.S. remained at the previous level of 2.7%. Core inflation accelerated to 3.1%, which is above forecasts. What does the preservation/growth of inflation mean?
From the perspective of the Federal Reserve's monetary policy, right now, it means nothing. The fact that headline inflation did not increase only raises the likelihood of a key rate cut in September. The fact that core inflation accelerated does not prove Jerome Powell right and does not affect the Fed's September decision, which may already have been made. Thus, the U.S. dollar's fall on Tuesday was entirely logical—there was no other way it could have gone. If the U.S. currency plunged in the first half of the year when the Fed's rhetoric was decidedly hawkish, then what should we expect now, when half of the FOMC members are talking about a rate cut?
On the 5-minute timeframe, several trading signals formed yesterday, but there was no point in trying to work them out. Throughout the European session, the price was testing the Kijun-sen line, but entering the market just a couple of hours before the inflation report would have been suicidal. Then, when the sharp growth began, there was no opportunity to open a long position in time. Trying to trade a rebound from the 1.1666 level or the subsequent breakout of the same level would be like trying to jump into the last carriage of a departing train.
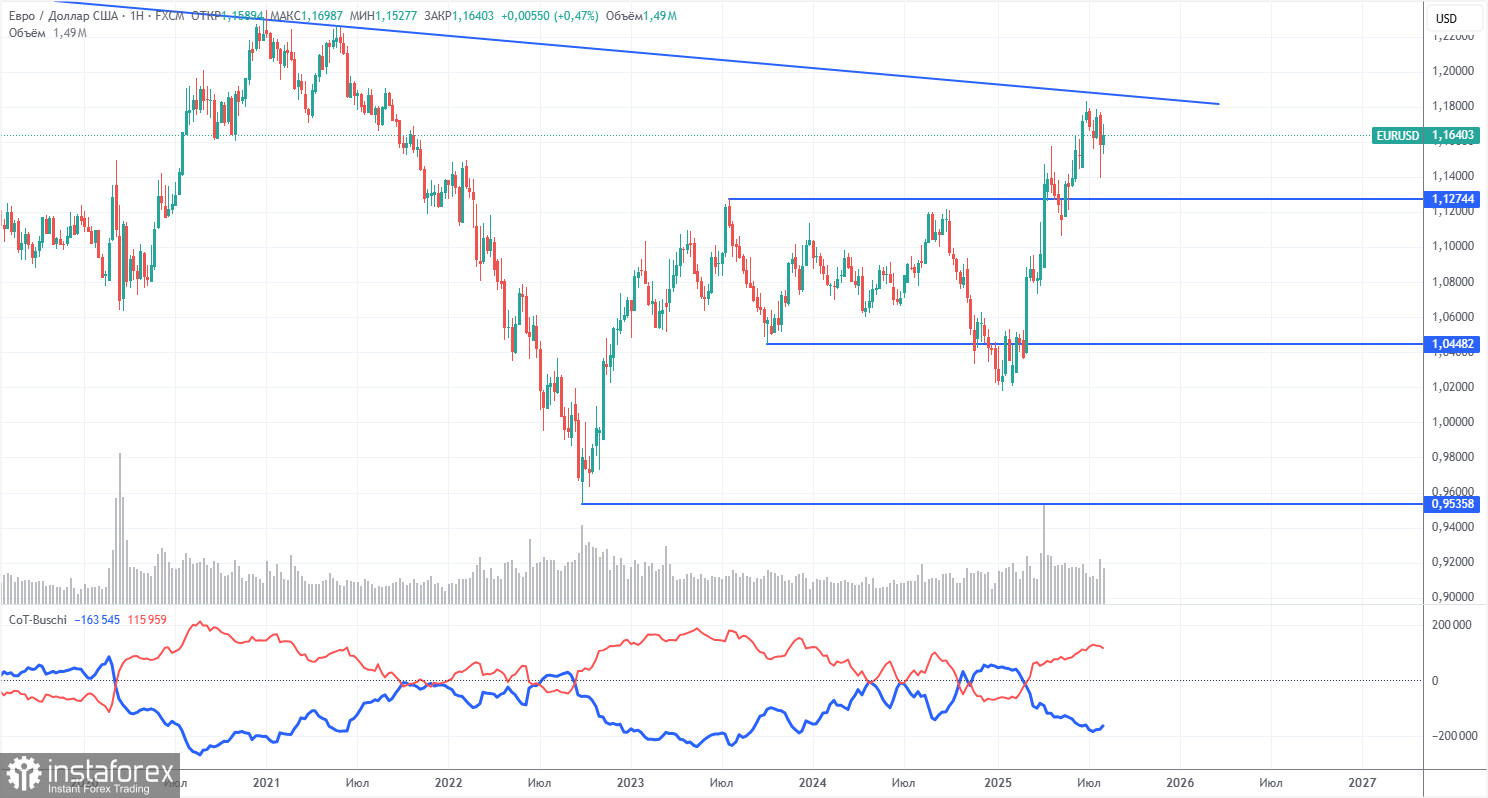
The latest COT report is dated August 5. As the chart above clearly shows, the net position of non-commercial traders had been bullish for a long time, while bears barely entered the dominance zone at the end of 2024 but quickly lost it. Since Trump took office, the dollar has only been falling. We cannot say with 100% certainty that the decline of the U.S. currency will continue, but current global developments point precisely in that direction.
We still see no fundamental factors for strengthening the euro, but there remains one very significant factor for the dollar's decline. The long-term downtrend remains intact, but at this point, what does it matter where the price has moved over the past 17 years? Once Donald Trump ends his trade wars, the dollar may start to rise, but recent events have shown that the war will continue in one form or another.
The positioning of the red and blue indicator lines still signals a bullish trend. During the last reporting week, the number of long positions among the "Non-commercial" group decreased by 1,400, while short positions increased by 5,900. As a result, the net position fell by 7,300 contracts over the week — an insignificant change.
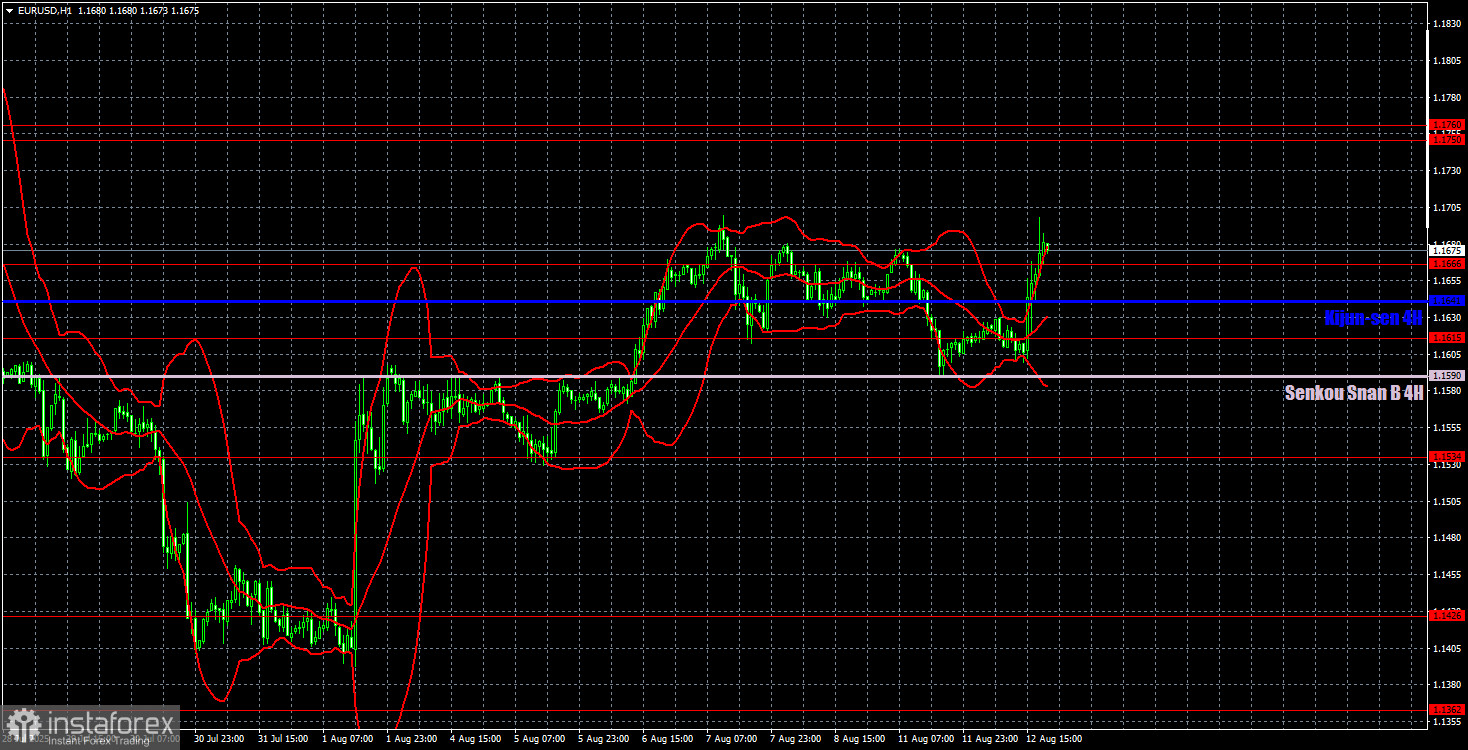
On the hourly timeframe, the EUR/USD pair continues to form a new upward trend. On the H1 chart, the price is located above the Senkou Span B line, and on the daily chart, it has bounced off the Senkou Span B line. Thus, considering both technical and fundamental factors, there are now far more reasons to expect a continued fall of the dollar than to expect a fall of the euro. The macroeconomic background also remains unfavorable for the dollar.
For August 13, we highlight the following trading levels: 1.1092, 1.1147, 1.1185, 1.1234, 1.1274, 1.1362, 1.1426, 1.1534, 1.1615, 1.1666, 1.1750–1.1760, 1.1846–1.1857, as well as the Senkou Span B line (1.1590) and Kijun-sen line (1.1641). The Ichimoku indicator lines can move during the day, which should be taken into account when identifying trading signals. Remember to move your Stop Loss to breakeven if the price moves 15 pips in the correct direction. This will protect against possible losses if the signal turns out to be false.
On Wednesday, the only scheduled report in the Eurozone is the second estimate of Germany's Consumer Price Index, which is a secondary report. In the United States, the event calendar is empty.
On Wednesday, prices may continue to rise based on a rebound from the Senkou Span B line (daily chart) and a rebound from the Senkou Span B line on the hourly chart. Therefore, we remain focused on long positions with a target of 1.1750–1.1760. At present, there are some signs of a flat market, and news today will be extremely scarce. Volatility may drop sharply.


